-
Population
Overview- Overview
- Population density
-
Households
Households- Housing
- Ratio
-
Urban Planning
Urban Planning- Land use
- Urban Planning
- Changes in administrative Districts
- administrative Districts
-
Water and sewage
Water and sewage- Water
- Sewage
-
City environment
City environment- Municipal solid wastes
- Air quality
- Parks
-
Urban transport
Urban transport- Roads
- Speed and Traffic volume
- Means of Transportation
Population
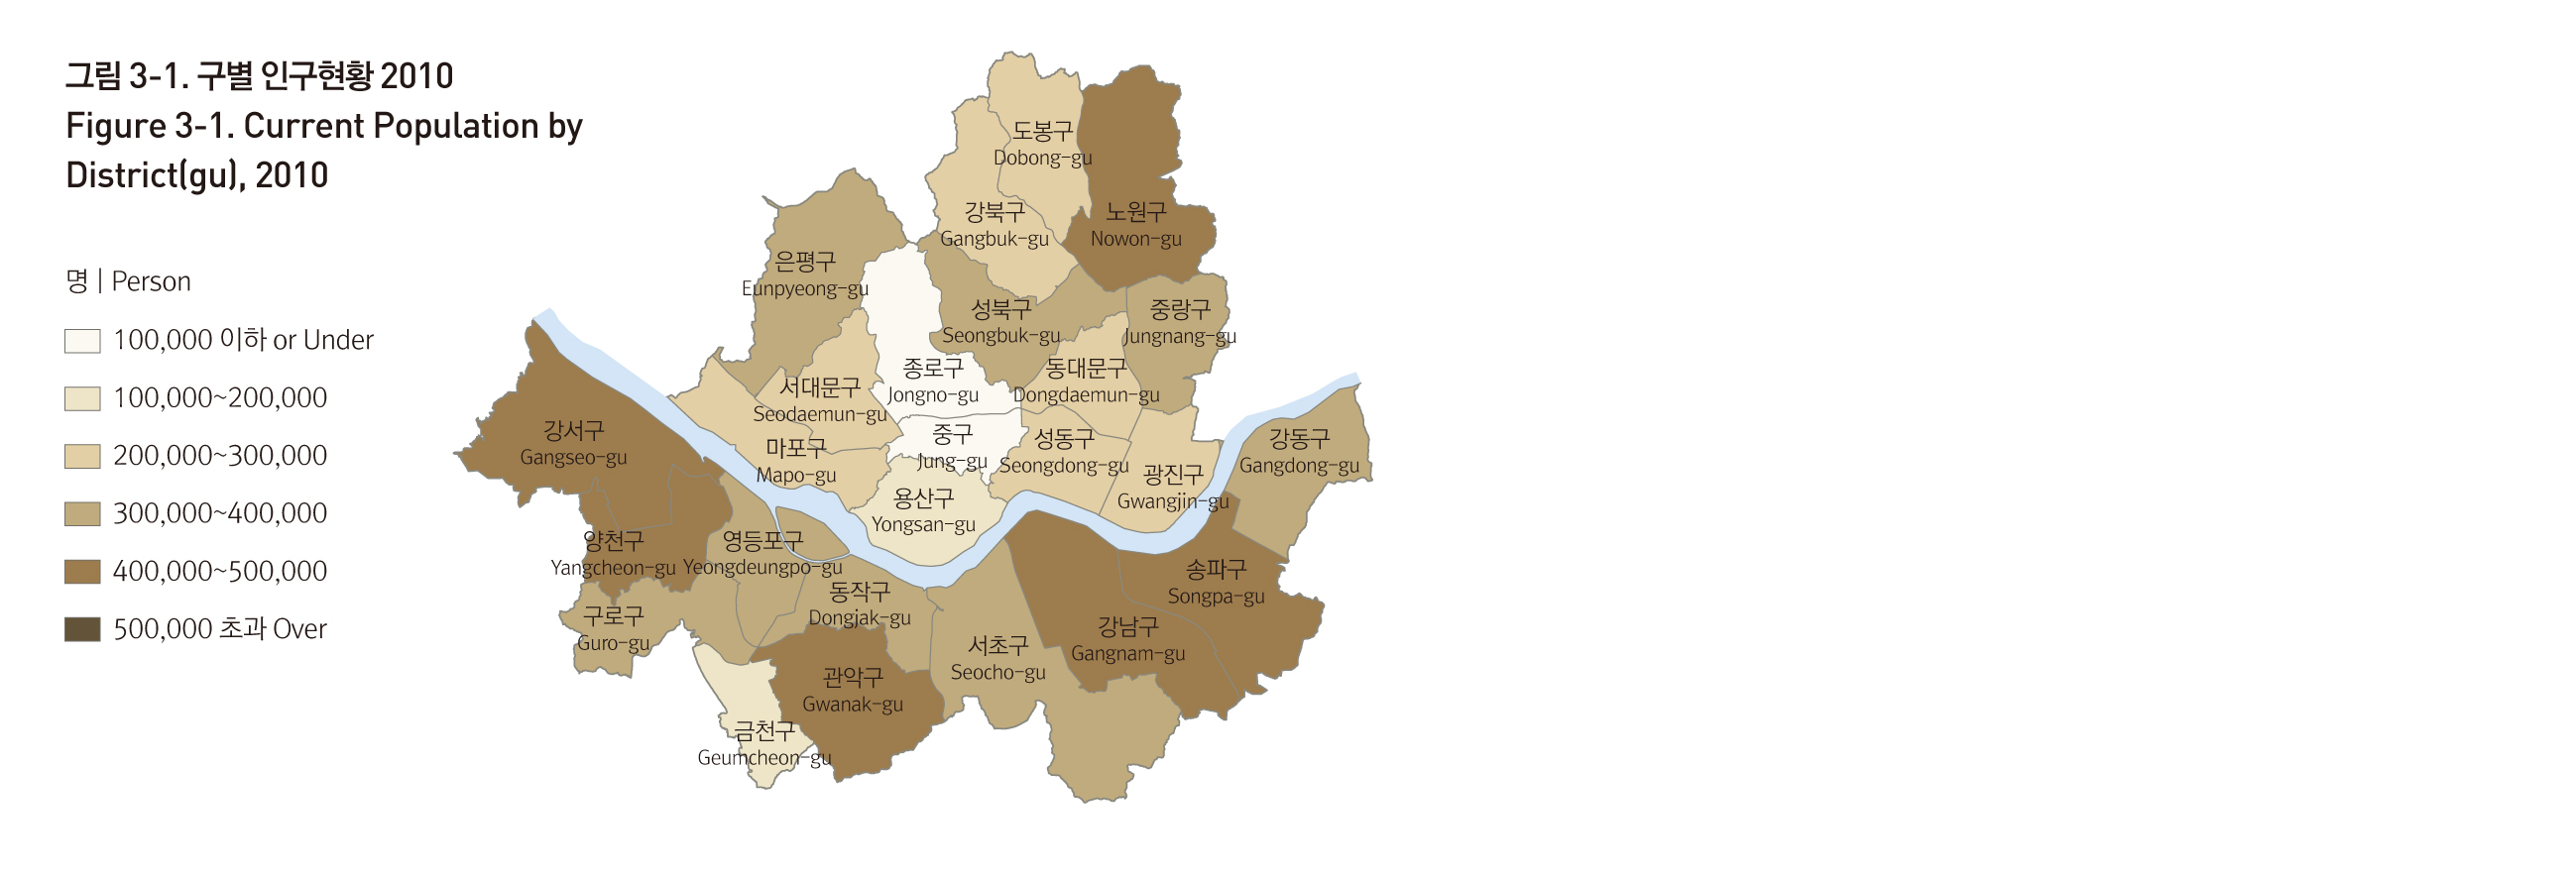
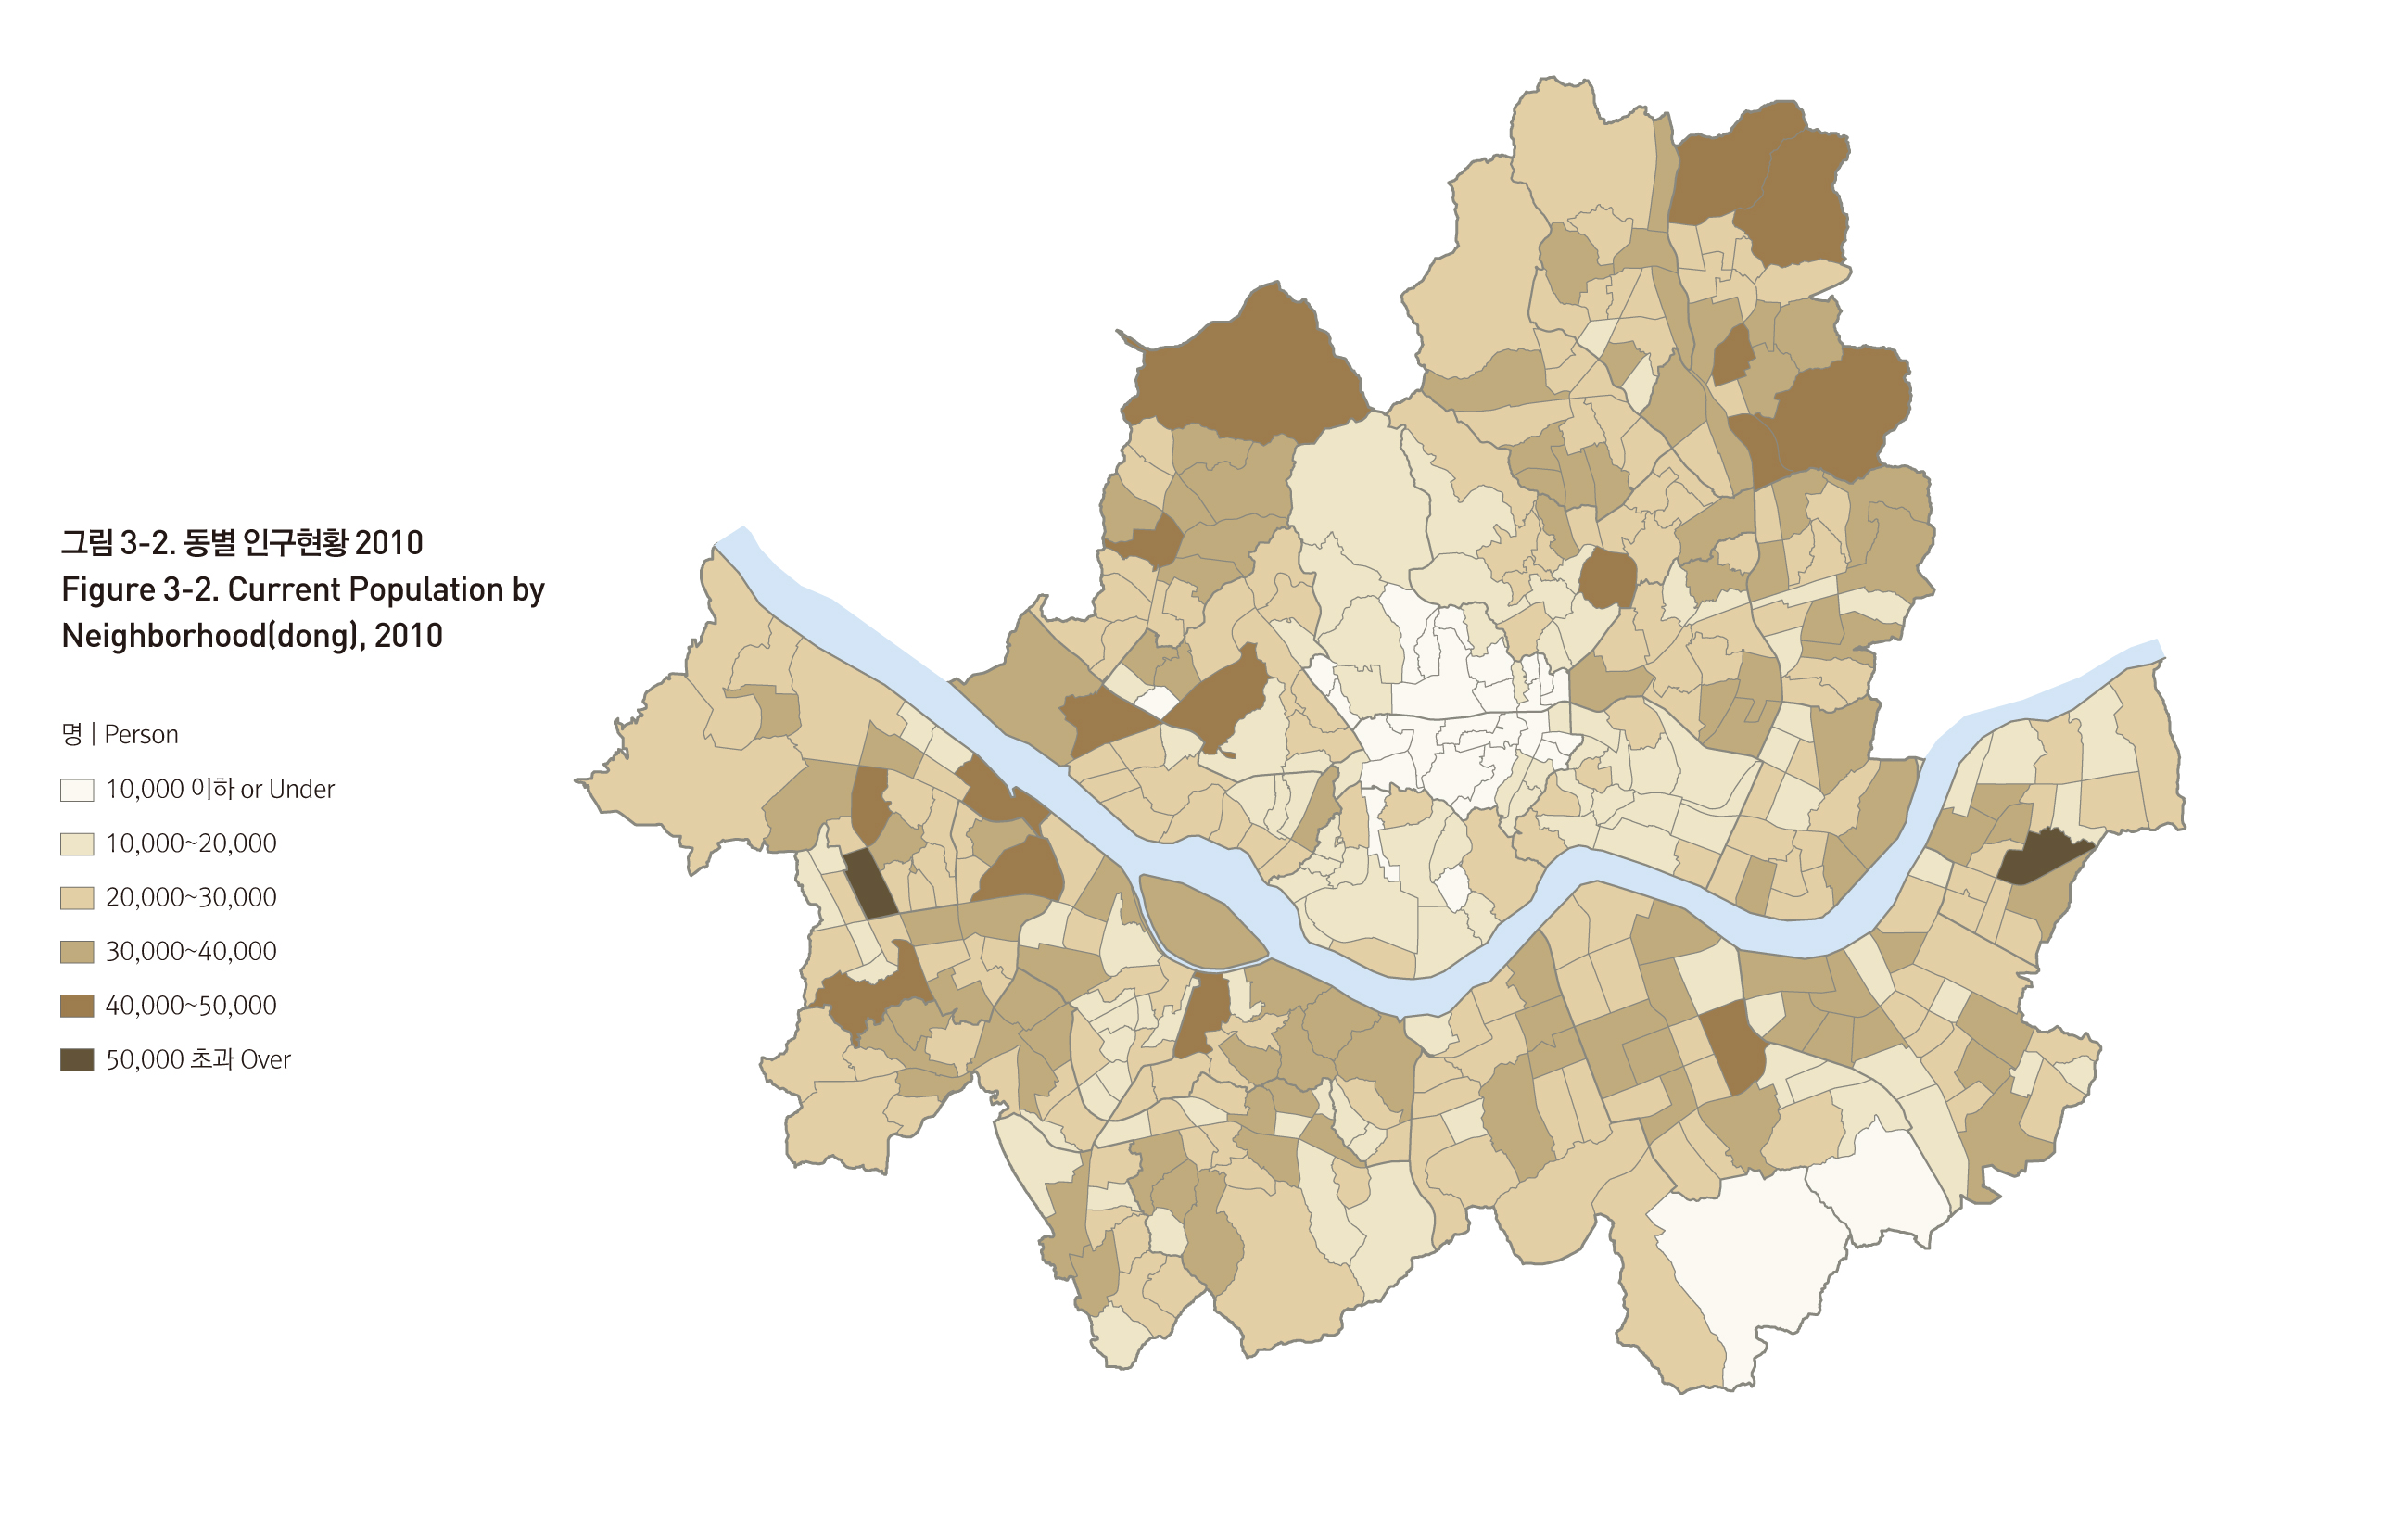
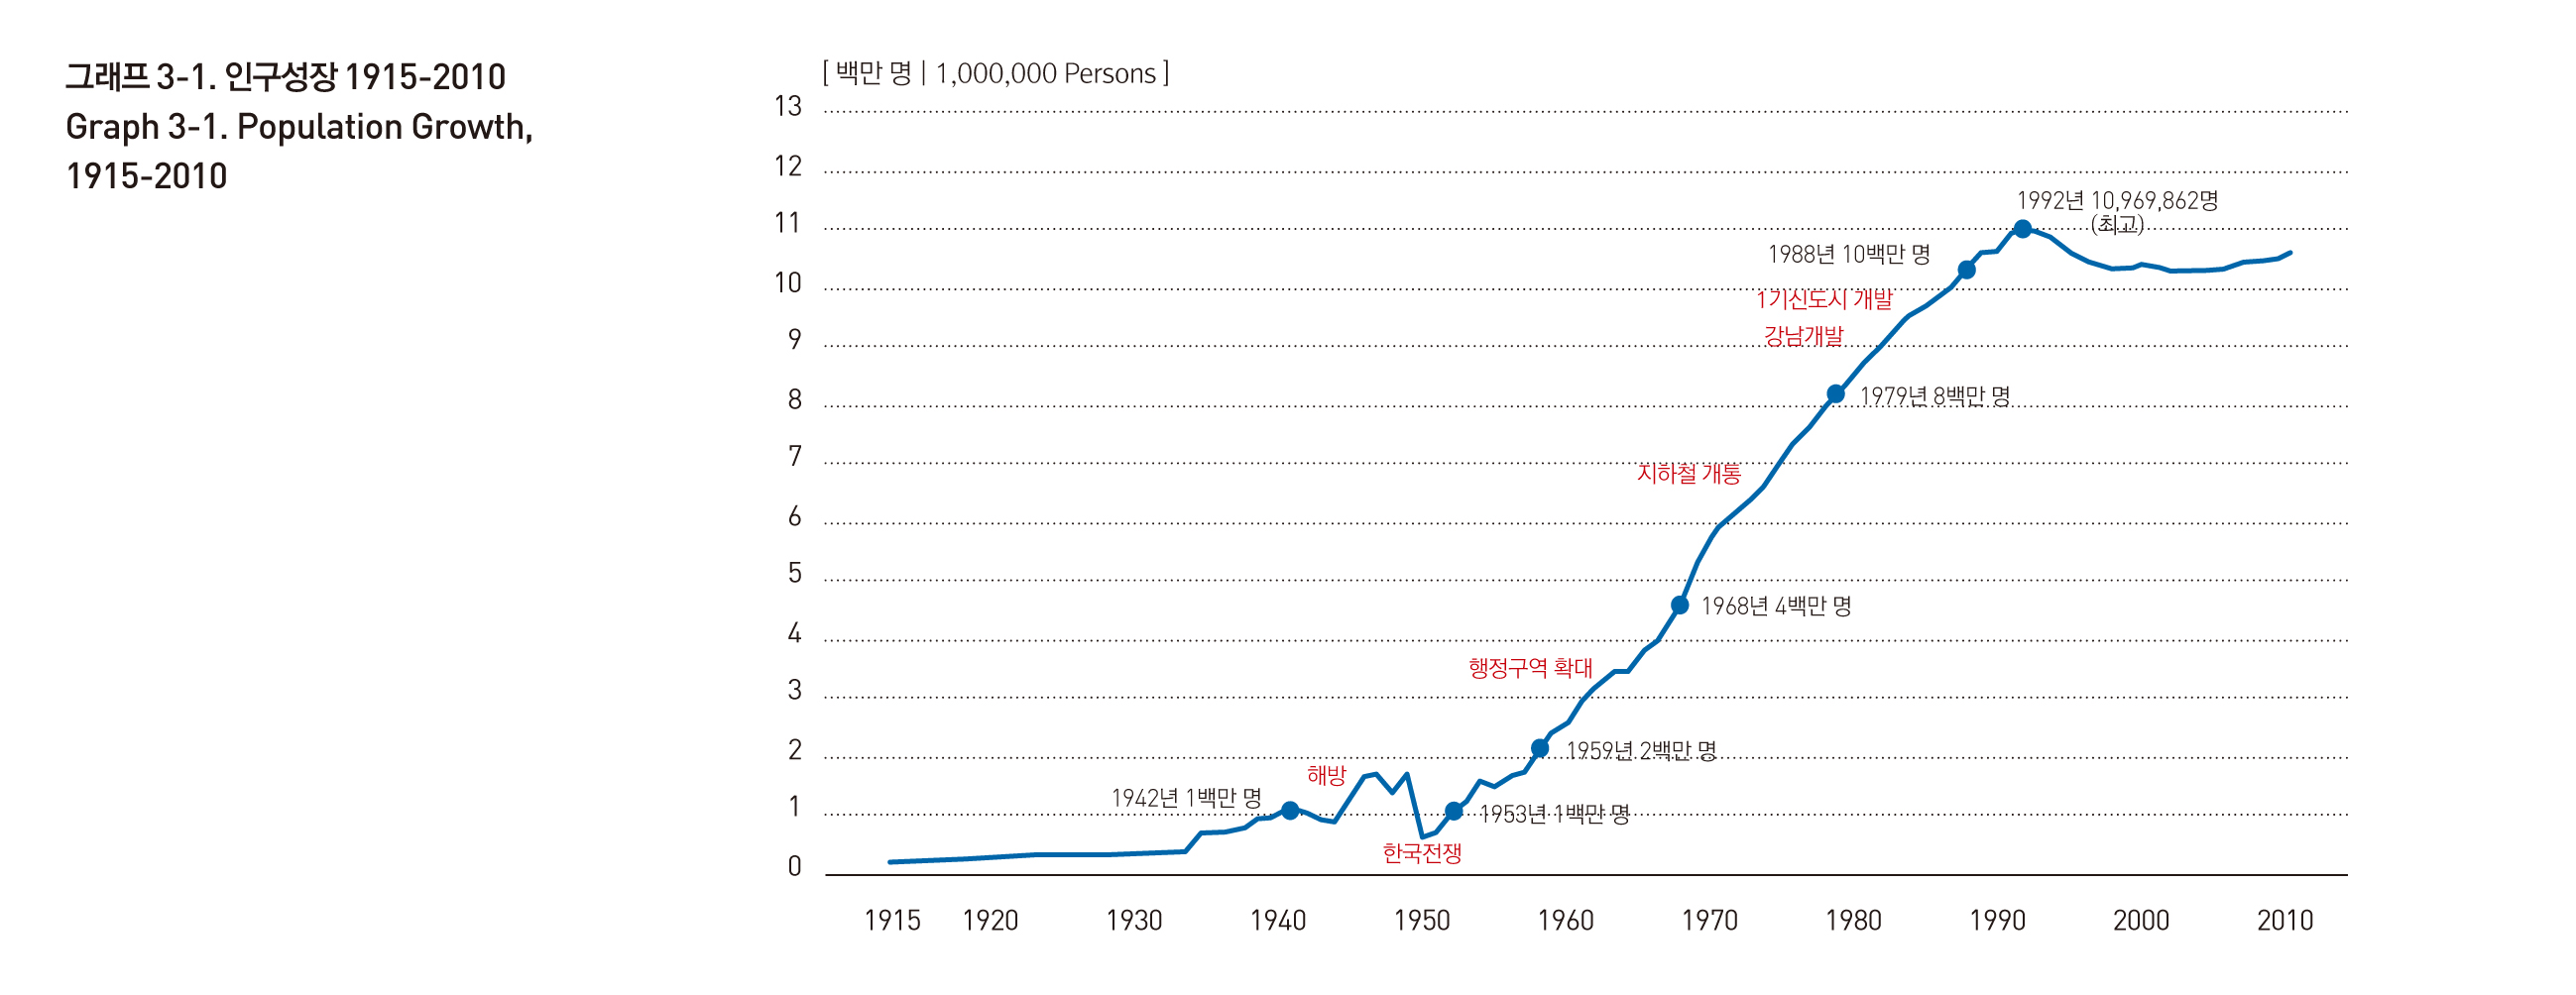
The first official record of Seoul's population, published in 1915, placed it to be about 240,000 people. In 1936, the population of Seoul rose 79.9%, due to the expansion of administrative boundaries. In 1942, the population exceeded 1 million for the first time and continued to expand into the 1980s with the development of the Gangnam areas. This trend in population growth came to a slowdown in the 1990s, reaching its peak at 10.97 million in 1992. From then onwards, the population of Seoul made a downward turn, due to suburbanization and low birth rate. As of late 2010, there are currently 10.58 million residents in Seoul, as the explosive population growth of the 20th century comes to a standstill for the first time in 100 years.
Source: The Social Maps of Seoul in The Seoul Research Data Service http://data.si.re.kr/map-seoul-2013
Origin : Seoul Metropolitan Government, Seoul Statistics, resident registration population, 2010년
Source: The Social Maps of Seoul in The Seoul Research Data Service http://data.si.re.kr/map-seoul-2013
Origin : Seoul Metropolitan Government, Seoul Statistics, resident registration population
Source: The Social Maps of Seoul in The Seoul Research Data Service http://data.si.re.kr/map-seoul-2013
POPULATION DENSITY
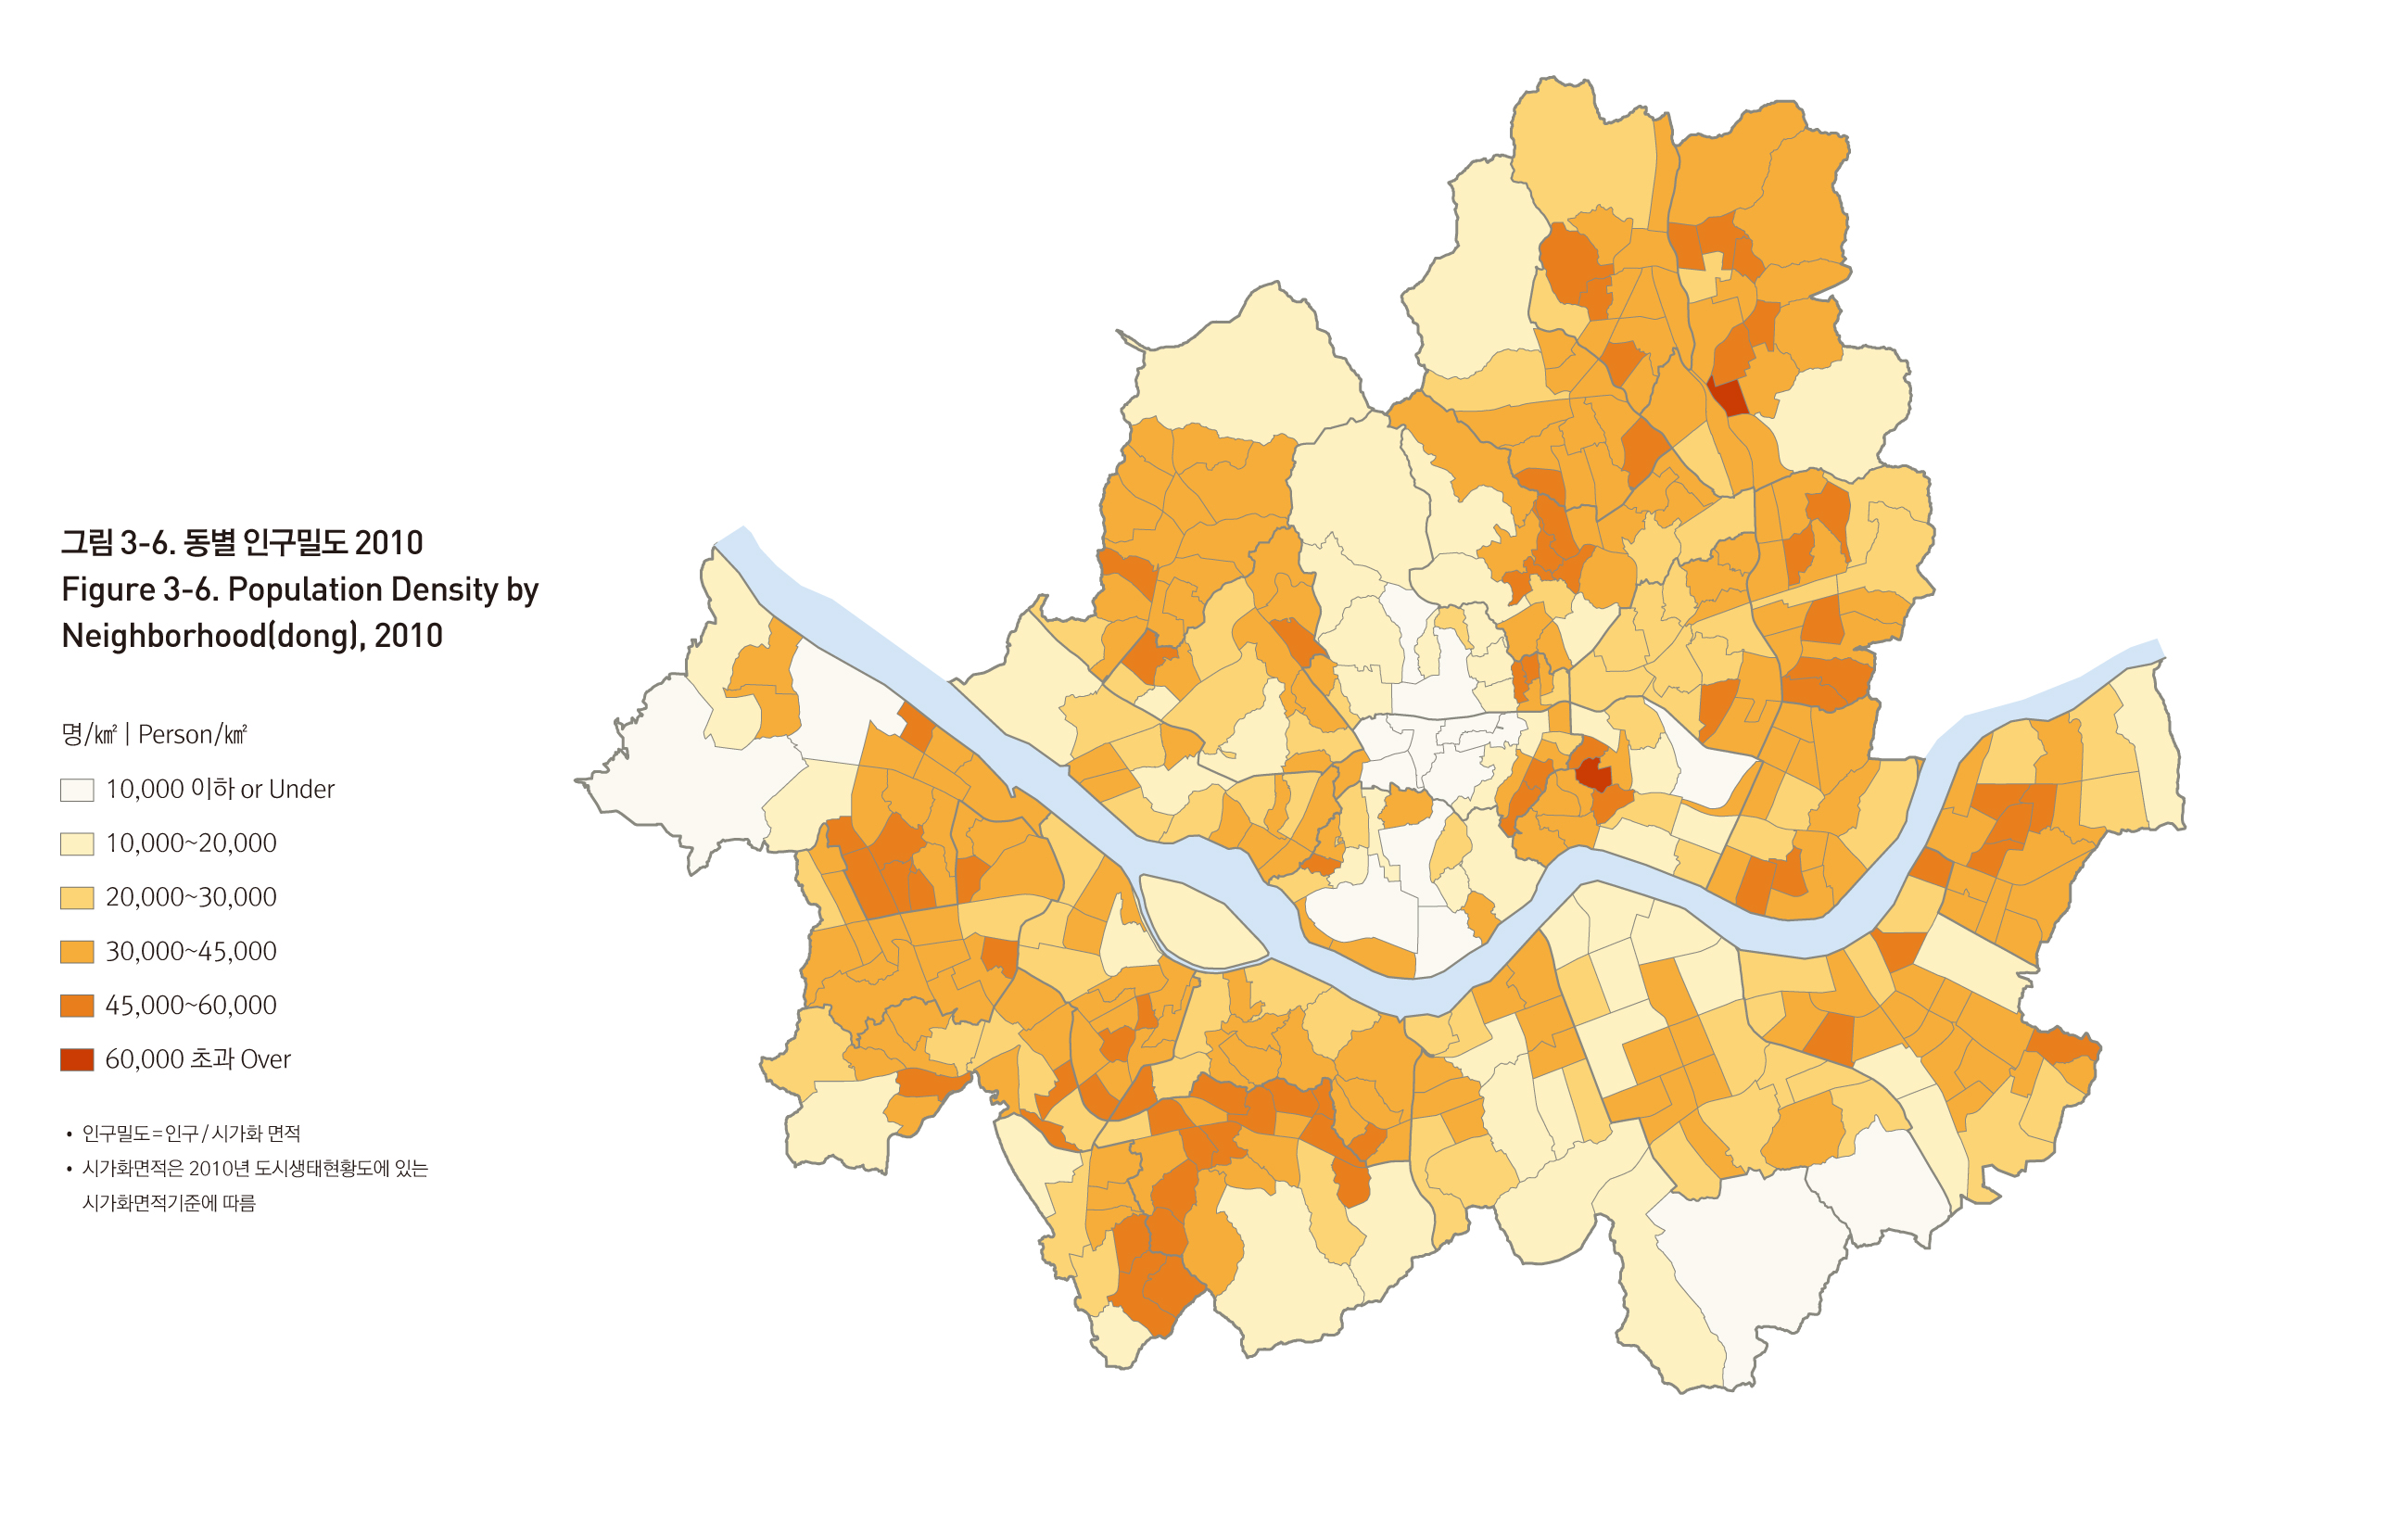
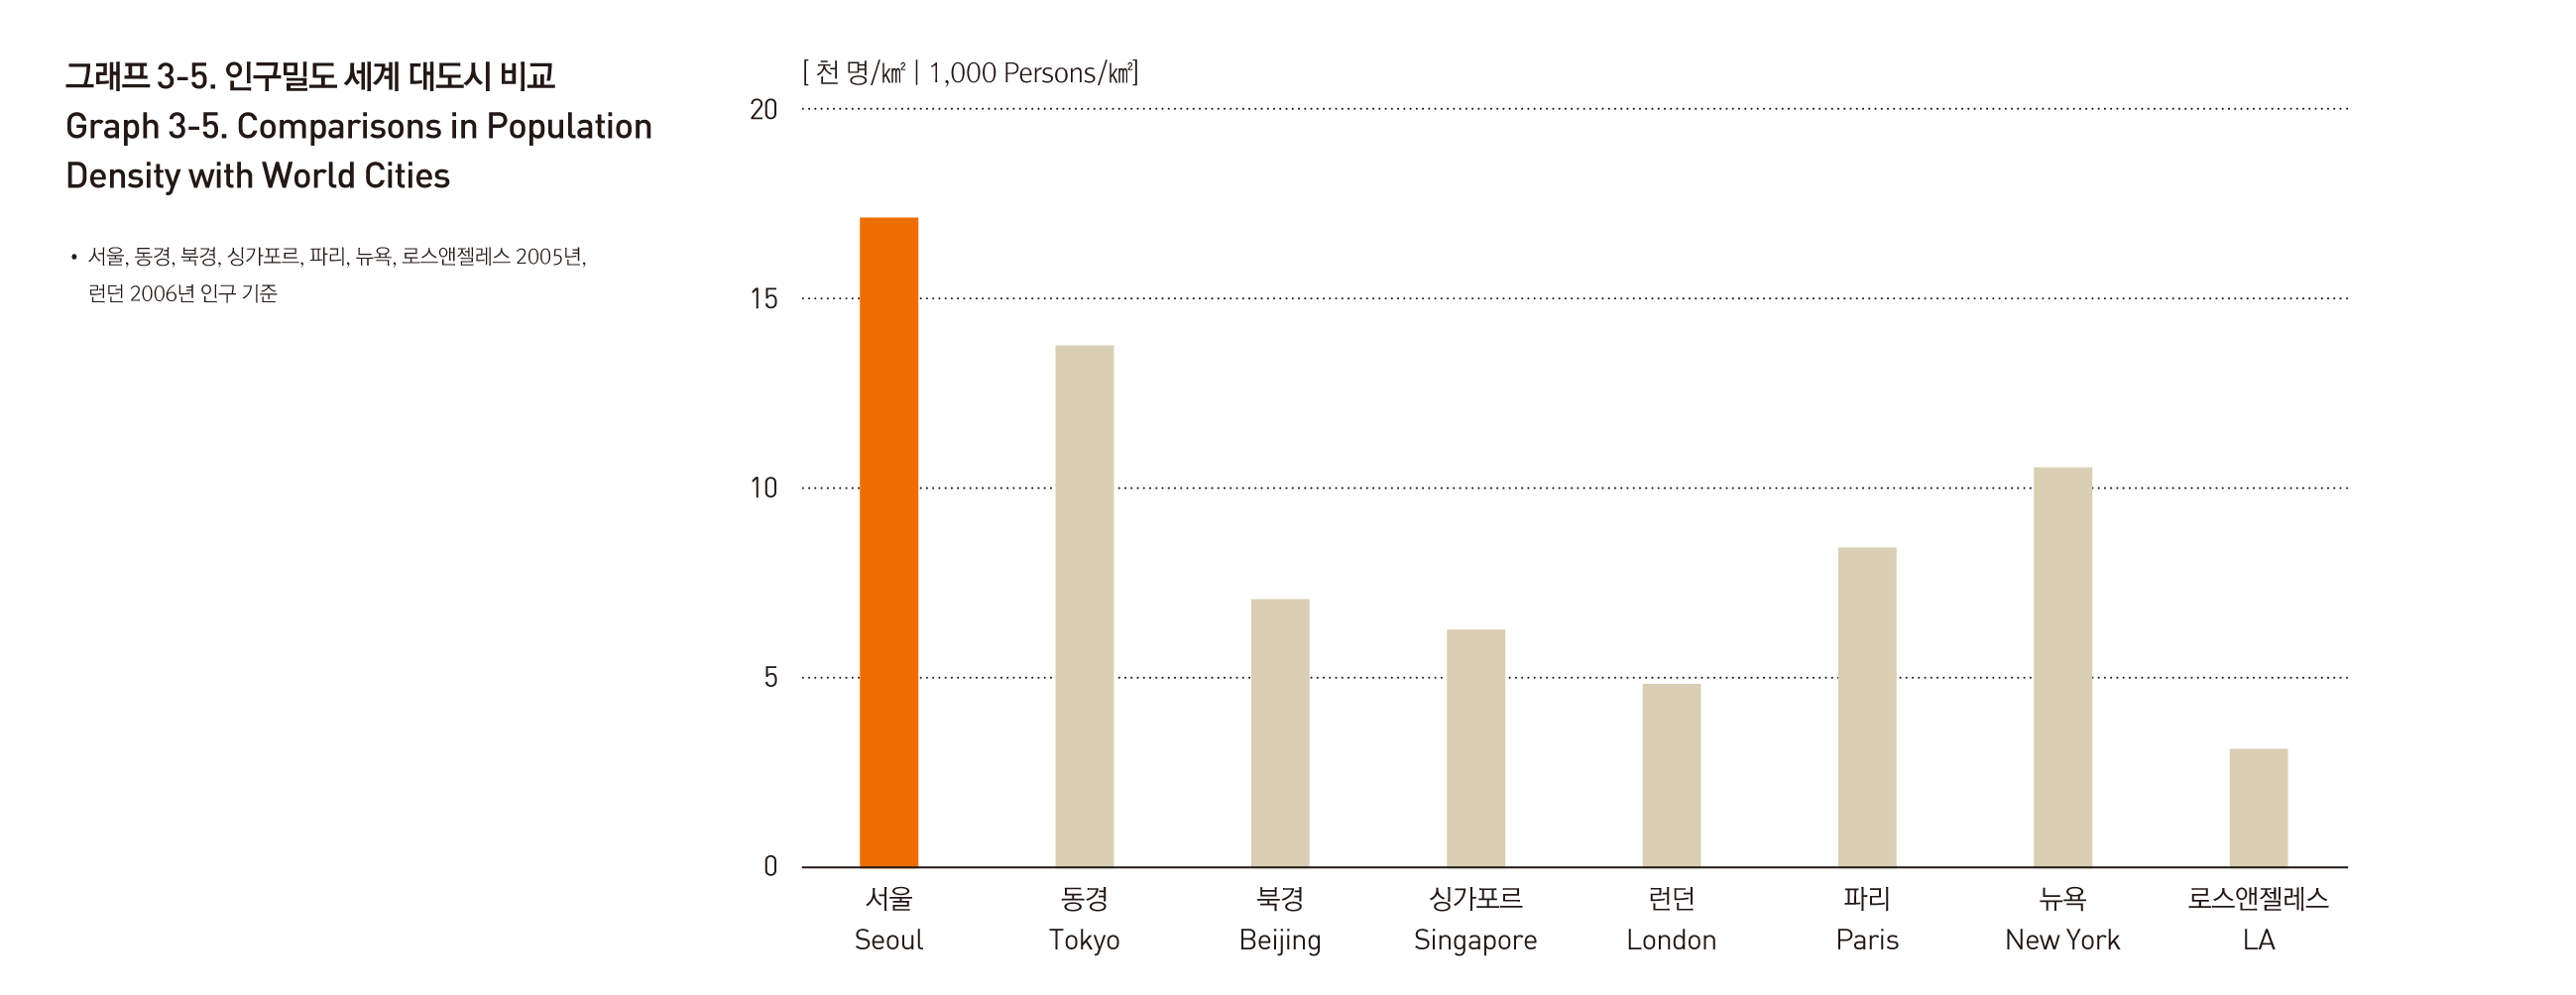
Barring administrative area expansions in 1949 and 1962, the rise in the population density of Seoul was continuous until the late 1990s. When the administrative area of Seoul was expanded to the current levels of 613.04㎢, the population density in Seoul was roughly 5,309/㎢. With the dramatic growth in population in the 1960s, the population density exceeded 10,000 peoplein 1973, and 15,000 in 1983, reaching its peak in 1992, at 18,000/㎢. The population of Seoul remained largely static since the late 1990s, the population density is currently 17,473/㎢. A comparison with other world cities shows that Seoul is one of the most crowded cities in the world, exceeding New York (10,483/㎢), Paris (8,401/㎢) and even Tokyo (13,650/㎢).
Source: The Social Maps of Seoul in The Seoul Research Data Service http://data.si.re.kr/map-seoul-2013

Origin : Seoul Metropolitan Government, Seoul Statistics, resident registration population, 2010
Ministry of Environment, Seoul Biotope Map, 2010
Source: The Social Maps of Seoul in The Seoul Research Data Service http://data.si.re.kr/map-seoul-2013

Origin : Seoul Metropolitan Government, Seoul Statistics
Source: The Social Maps of Seoul in The Seoul Research Data Service http://data.si.re.kr/map-seoul-2013
Origin : Seoul Institute, 6개 대도시 현황과 발전전망, 2008년
Seoul Institute, 12개 주요 대도시 통계현황, 2008년
Source: The Social Maps of Seoul in The Seoul Research Data Service http://data.si.re.kr/map-seoul-2013
HOUSING
Housing in Seoul was supplied on a massive scale during the late 1980s, early 1990s, and early 2000s. During the early 1990s, more than 100,000 housing units were supplied each year, before it all came to a halt during the IMF crisis. The early 2000s saw another influx of housing supply when pre-IMF plans resumed and older apartments began to be redeveloped. Supply again withdrew during the global financial crisis of 2008, but has picked up since then to 90,000 houses in 2011, due to the increased development of smaller houses and multiplexes.
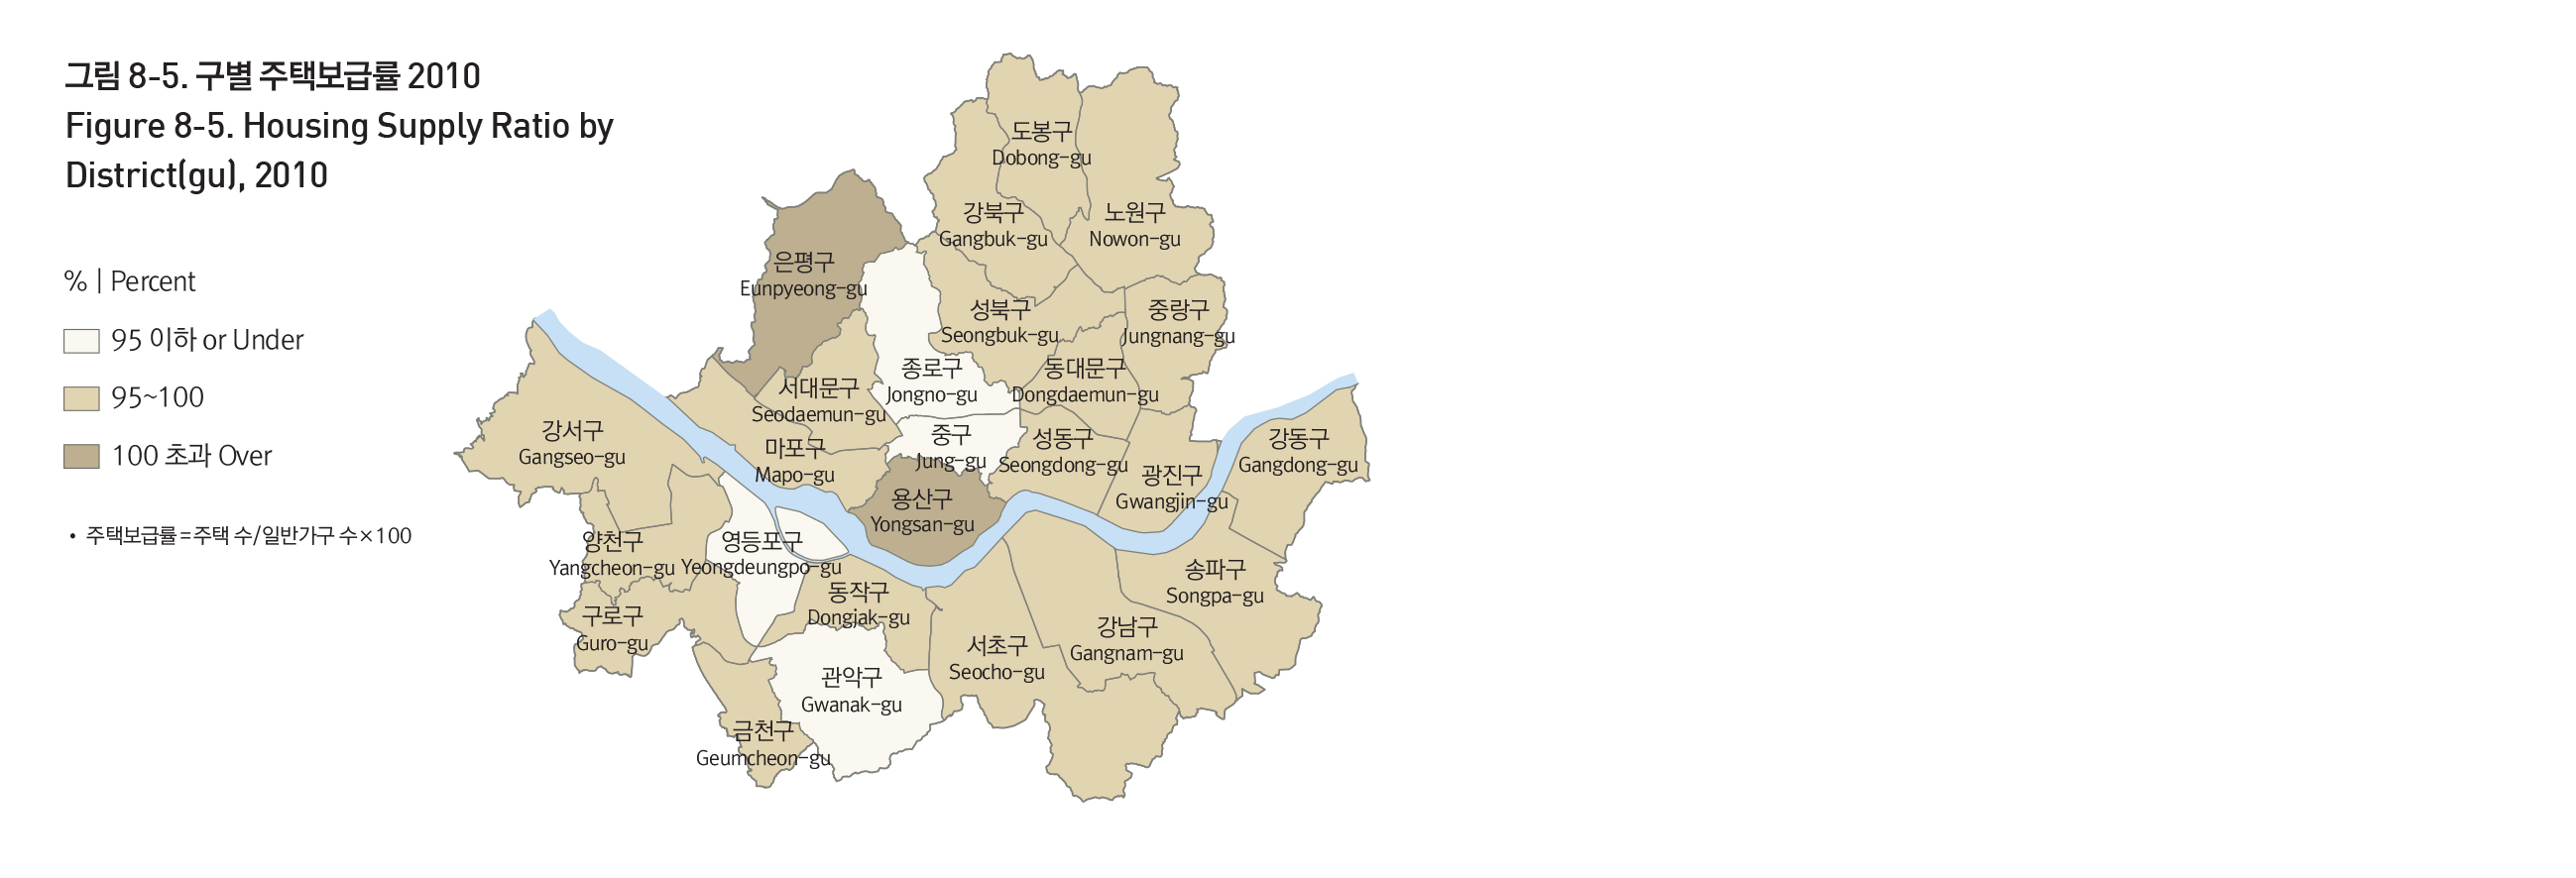
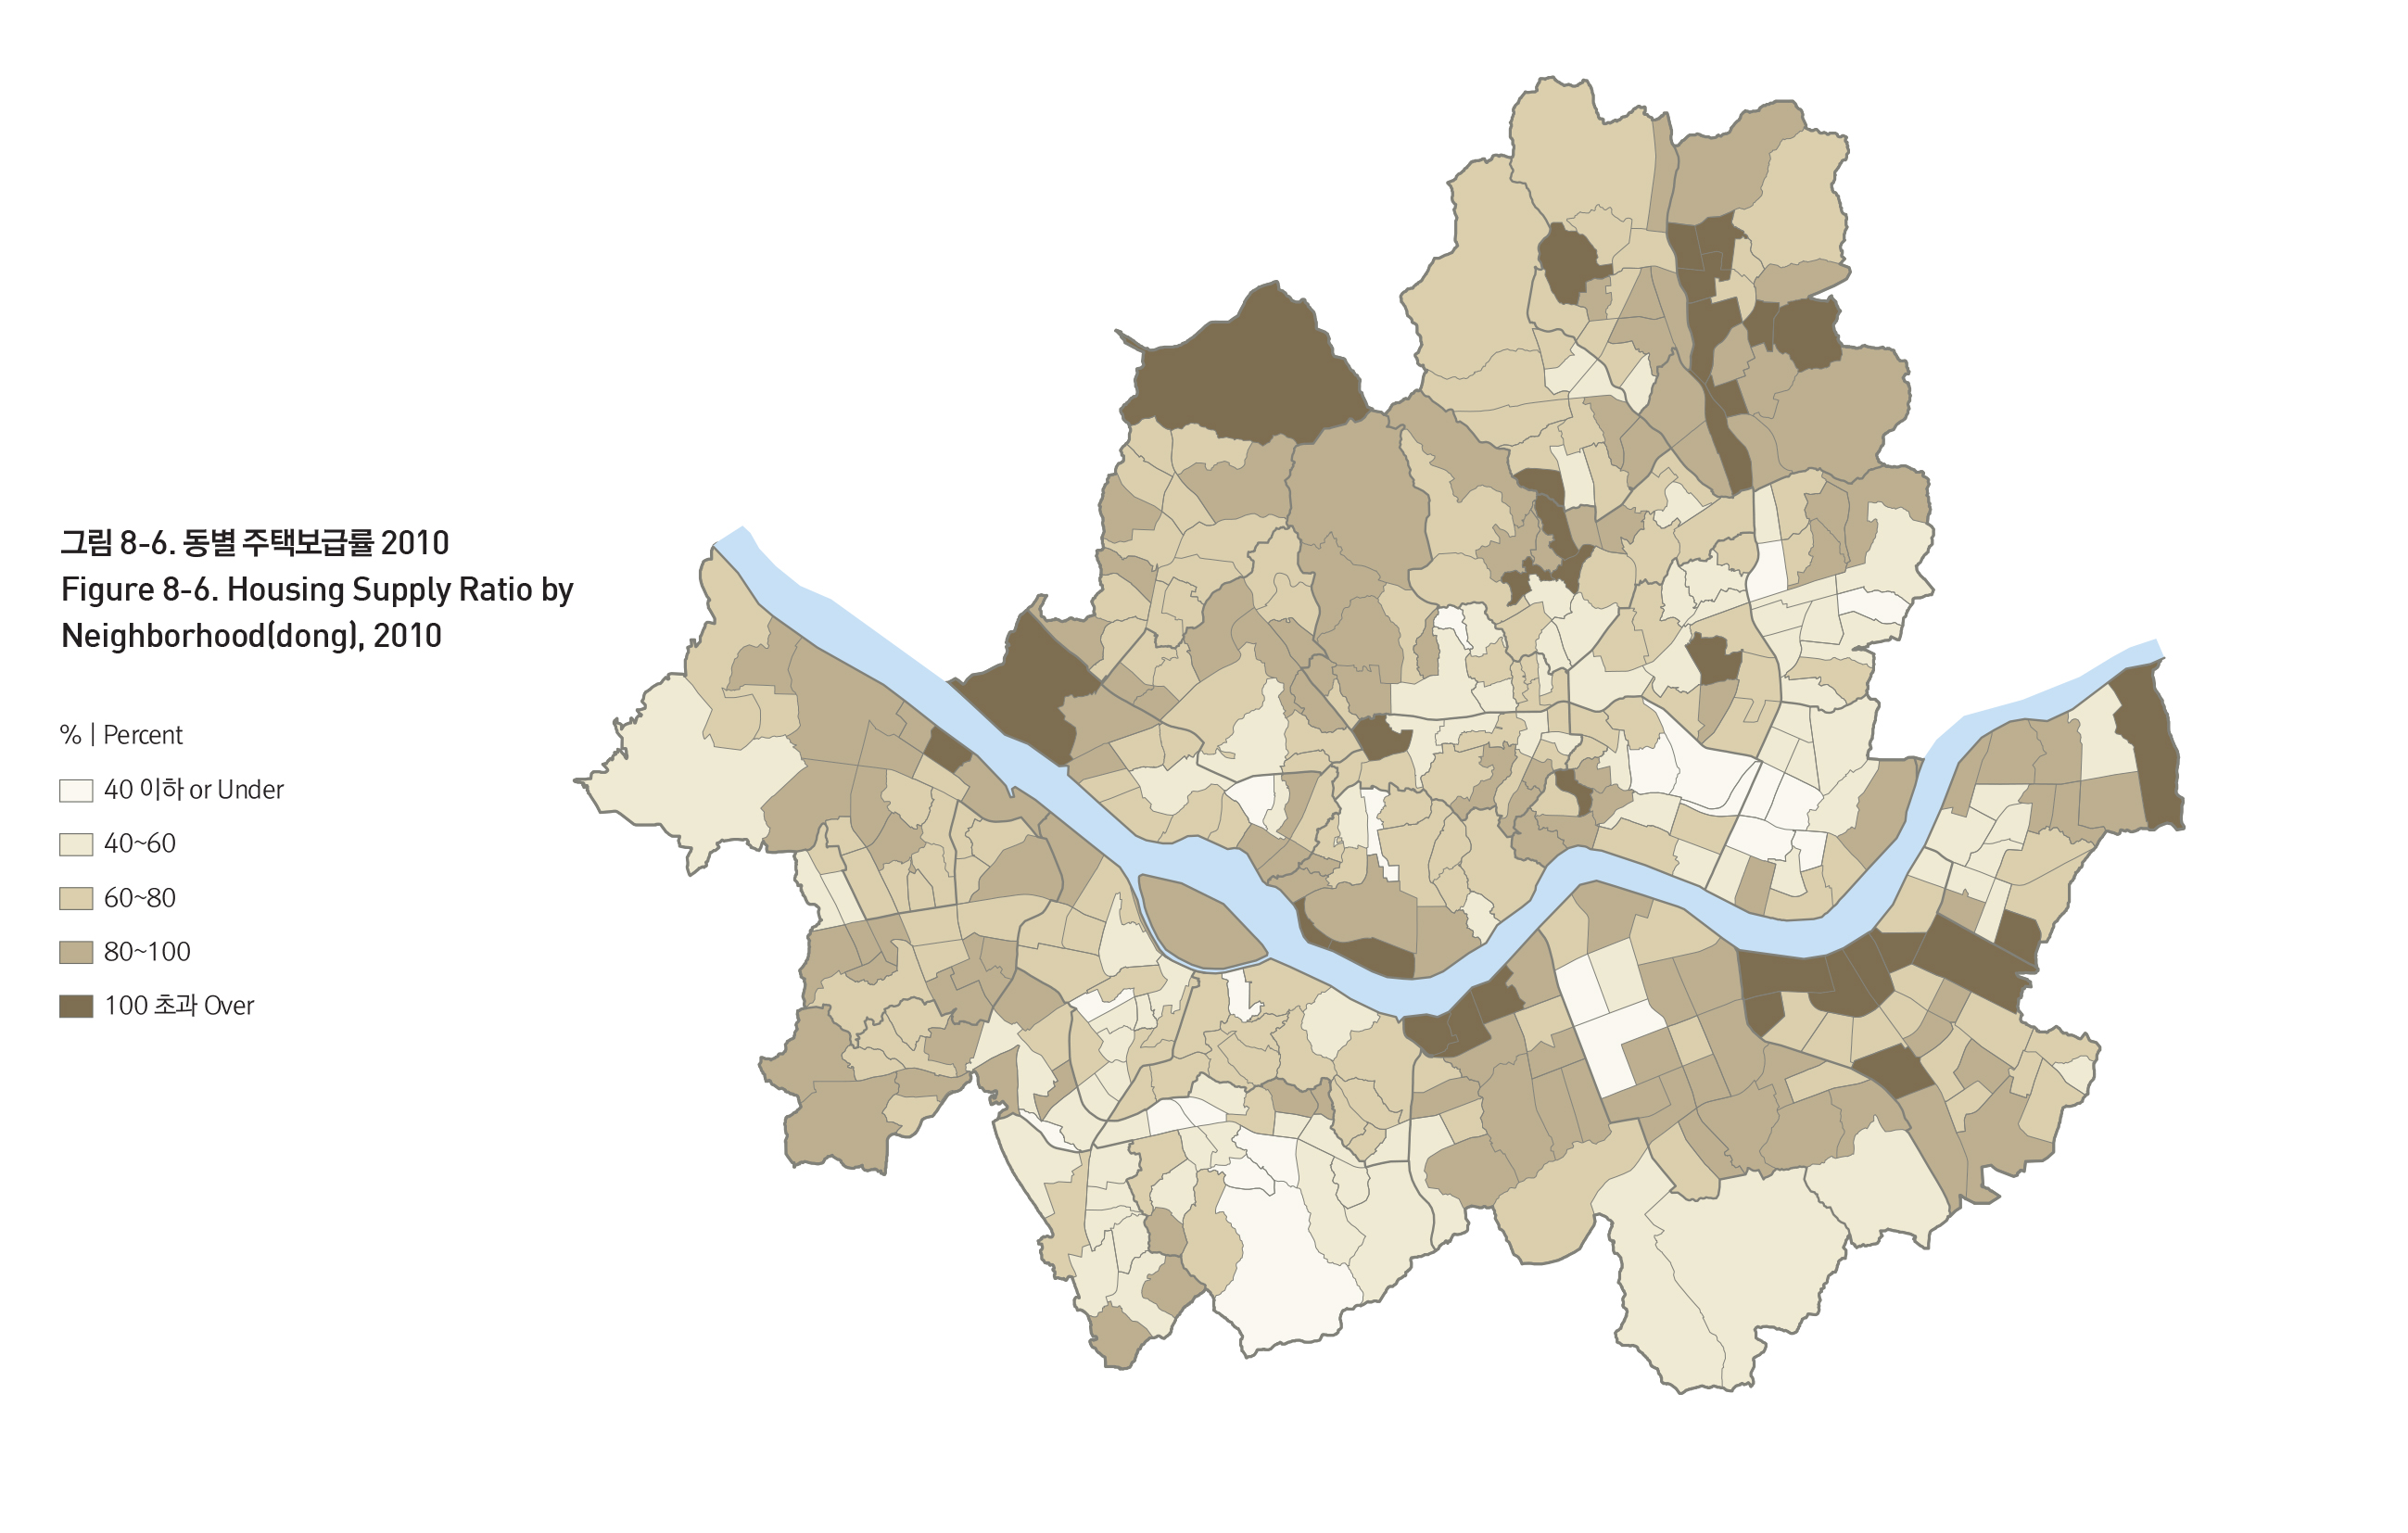
Nowon-gu, Songpa-gu, and Gangseo-gu are districts with the largest housing supply, while Junggye2/3-dong, Jingwan-dong, and Sanggye6/7-dong are the neighborhoods with the largest housing supply.
Source: The Social Maps of Seoul in The Seoul Research Data Service http://data.si.re.kr/map-seoul-2013


Origin : 통계청, 인구주택총조사, 2010년
Source: The Social Maps of Seoul in The Seoul Research Data Service http://data.si.re.kr/map-seoul-2013

Origin : Seoul Metropolitan Government, Seoul Statistics, 국토해양부, 국토해양통계누리
Source: The Social Maps of Seoul in The Seoul Research Data Service http://data.si.re.kr/map-seoul-2013
HOUSING SUPPLY TO DEMAND RATIO
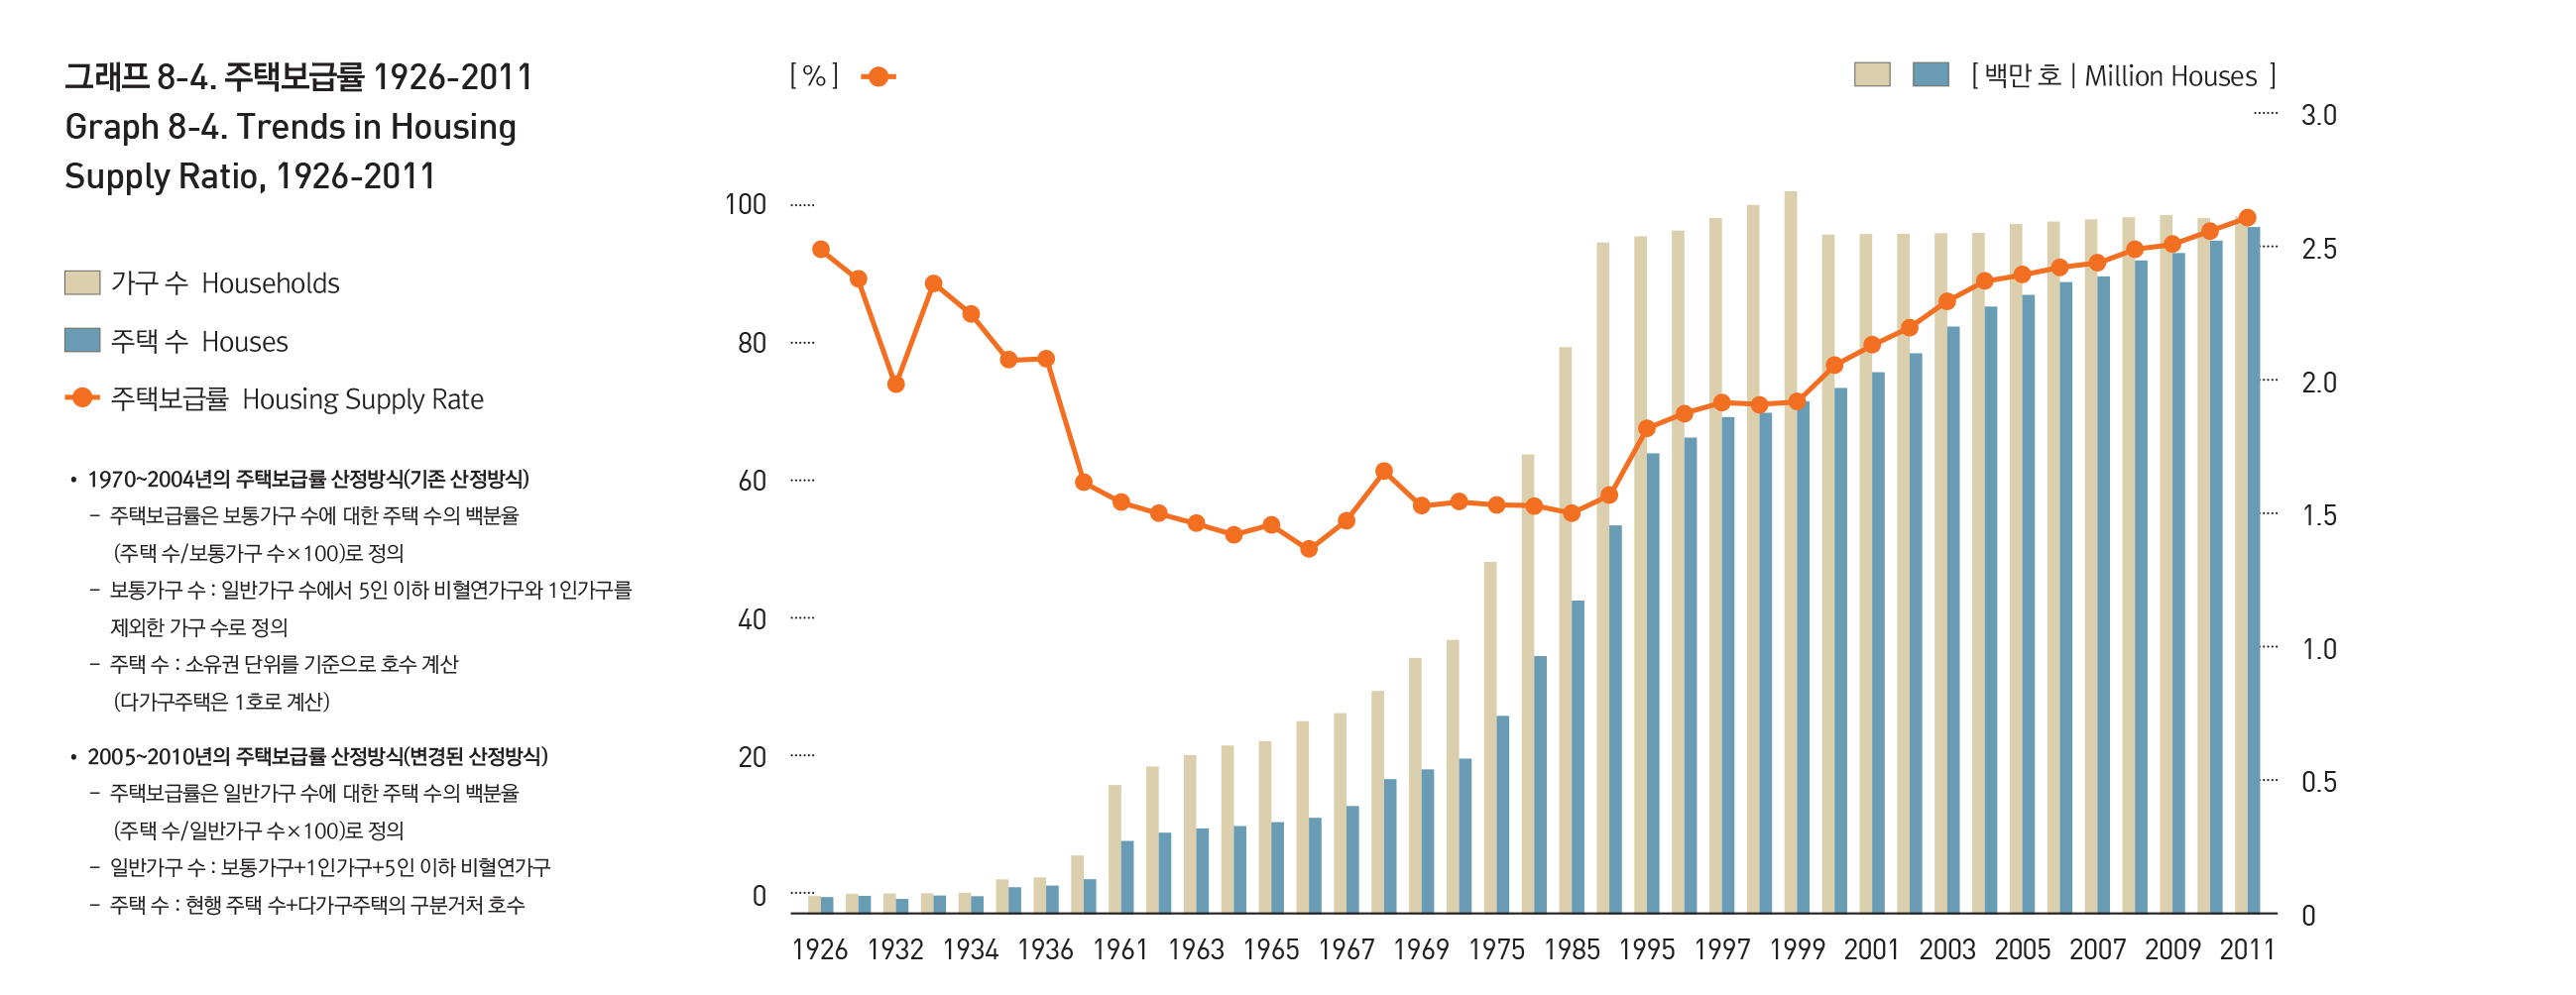
Housing supply was very high in 1926, at 94.2%, but since then, housing supply ratio declined steadily despite continued housing supply, due to the explosive growth in population. After reaching its lowest point in 1966 at 50%, housing supply ratio began to recover from 1967 onwards and improved especially during the 1990s because of the 2 million Housing Unit Construction Plan starting in 1988 and the slowed growth in the number of households. As of now, the housing supply ratio in Seoul is 98.4%, an all-time high for the data.
Source: The Social Maps of Seoul in The Seoul Research Data Service http://data.si.re.kr/map-seoul-2013
Origin : 통계청, 인구주택총조사, 2010년
Source: The Social Maps of Seoul in The Seoul Research Data Service http://data.si.re.kr/map-seoul-2013
Origin : Seoul Metropolitan Government, Seoul Statistics
Source: The Social Maps of Seoul in The Seoul Research Data Service http://data.si.re.kr/map-seoul-2013
LAND USE
Land use surveys are basic steps in the management and planning of the city. According to 2010 Biotope Maps, land use in Seoul consists of 31.9% forest and open space, 18.9% residential area, 13.0% mixed residential and business area, 10.5% transportation facilities area, 8.1% river, stream, or wetland, 5.9% commercial and business area, and 5.1% public facilities area, etc. The spatial distribution of land use shows the how the built-up areas have developed in accordance to the city's key natural features. In particular, the hilly areas around the mountains and the long stretch of waterfront have always been important issues for city planners with regards to the scenery and the population density of Seoul.
Source: The Social Maps of Seoul in The Seoul Research Data Service http://data.si.re.kr/map-seoul-2013

Origin : Ministry of Environment, Seoul Biotope Map, 2010년
Source: The Social Maps of Seoul in The Seoul Research Data Service http://data.si.re.kr/map-seoul-2013
표 9-1. 토지이용별 면적비율 2010
| 토지이용유형 | 면적 | 비율 |
|---|---|---|
| 주택지 | 118,853,767 | 19.5 |
| 상업 및 업무시설지 | 35,928,608 | 5.9 |
| 혼합지 | 77,752,590 | 12.8 |
| 공업지 | 6,074,006 | 1.0 |
| 공공용도지 | 32,786,912 | 5.4 |
| 교통시설지 | 66,056,422 | 10.9 |
| 도시부양시설지 | 6,739,591 | 1.1 |
| 나지 | 12,240,195 | 2.0 |
| 특수지역 | 14,490,734 | 2.4 |
| 녹지 및 오픈스페이스 | 188,179,176 | 30.9 |
| 하천 및 호소 | 49,216,759 | 8.1 |
| 총합계 | 608,318,759 | 100 |
Origin : Ministry of Environment, Seoul Biotope Map, 2010년
Source: The Social Maps of Seoul in The Seoul Research Data Service http://data.si.re.kr/map-seoul-2013
URBAN PLANNING
Today, city planning in Seoul operates under the 2020 Seoul Master Plan, as well as separate urban management plans which serve to implement the master plan. Notable examples of urban management plans include designation plans for determining the use and density of special-purpose areas and districts, as well as detailed district-level plans for the purpose of developing and managing specific districts.
According to Seoul's 2012 urban management plans on zoning district area designations, residential zones make up 51.1%, green zones 40.1%, semi-commercial zones 4.6%, and commercial zones 4.3% of the land in Seoul. Meanwhile, special purpose areas, created under the purpose of complementing the features of zoning districts, consist of high areas (45.3%) facility protection areas (32.9%), aesthetic areas (11.3%), scenic areas (6.6%), and etc.
Source: The Social Maps of Seoul in The Seoul Research Data Service http://data.si.re.kr/map-seoul-2013

Origin : Seoul Metropolitan Government, 도시계획정보관리시스템(UPIS), 2012년
Source: The Social Maps of Seoul in The Seoul Research Data Service http://data.si.re.kr/map-seoul-2013

Origin : Seoul Metropolitan Government, 도시계획정보관리시스템(UPIS), 2012년
Source: The Social Maps of Seoul in The Seoul Research Data Service http://data.si.re.kr/map-seoul-2013
표 9-2. 용도지역 2012
| 용도지역 | 면적 | 비율 |
|---|---|---|
| 제1종전용주거지역 | 5,445,969 | 0.9 |
| 제2종전용주거지역 | 844,368 | 0.1 |
| 제1종일반주거지역 | 64,594,960 | 10.7 |
| 제2종일반주거지역 | 132,938,478 | 21.9 |
| 제3종일반주거지역 | 94,174,496 | 15.5 |
| 준주거지역 | 11,619,587 | 1.9 |
| 중심상업지역 | 360,078 | 0.1 |
| 일반상업지역 | 23,246,007 | 3.8 |
| 근린상업지역 | 807,068 | 0.1 |
| 유통상업지역 | 1,557,824 | 0.3 |
| 준공업지역 | 27,645,005 | 4.6 |
| 녹지지역 | 242,724,160 | 40.1 |
| 합계 | 605,958,000 | 100 |
Origin : Seoul Metropolitan Government, 도시계획정보관리시스템(UPIS), 2012년
Source: The Social Maps of Seoul in The Seoul Research Data Service http://data.si.re.kr/map-seoul-2013
Origin : Seoul Metropolitan Government, 도시계획정보관리시스템(UPIS), 2012년
Source: The Social Maps of Seoul in The Seoul Research Data Service http://data.si.re.kr/map-seoul-2013

Origin : Seoul Metropolitan Government, 도시계획정보관리시스템(UPIS), 2012년
Source: The Social Maps of Seoul in The Seoul Research Data Service http://data.si.re.kr/map-seoul-2013
표 9-3. 용도지구 2012
| 용도지구 | 면적 | 비율 |
|---|---|---|
| 경관지구 | 13,110,938 | 6.6 |
| 미관지구 | 22,396,297 | 11.3 |
| 고도지구 | 89,634,269 | 45.3 |
| 방화지구 | 3,466,330 | 1.8 |
| 보존지구 | 630,462 | 0.3 |
| 시설보호지구 | 65,201,700 | 33 |
| 취락지구 | 379,065 | 0.2 |
| 개발진흥지구 | 2,155,877 | 1.1 |
| 문화지구 | 622,312 | 0.3 |
| 기타 | 203,670 | 0.1 |
| 합계 | 197,800,920 | 100 |
Origin : Seoul Metropolitan Government, 도시계획정보관리시스템(UPIS), 2012년
Source: The Social Maps of Seoul in The Seoul Research Data Service http://data.si.re.kr/map-seoul-2013
CHANGES IN ADMINISTRATIVE DISTRICTS
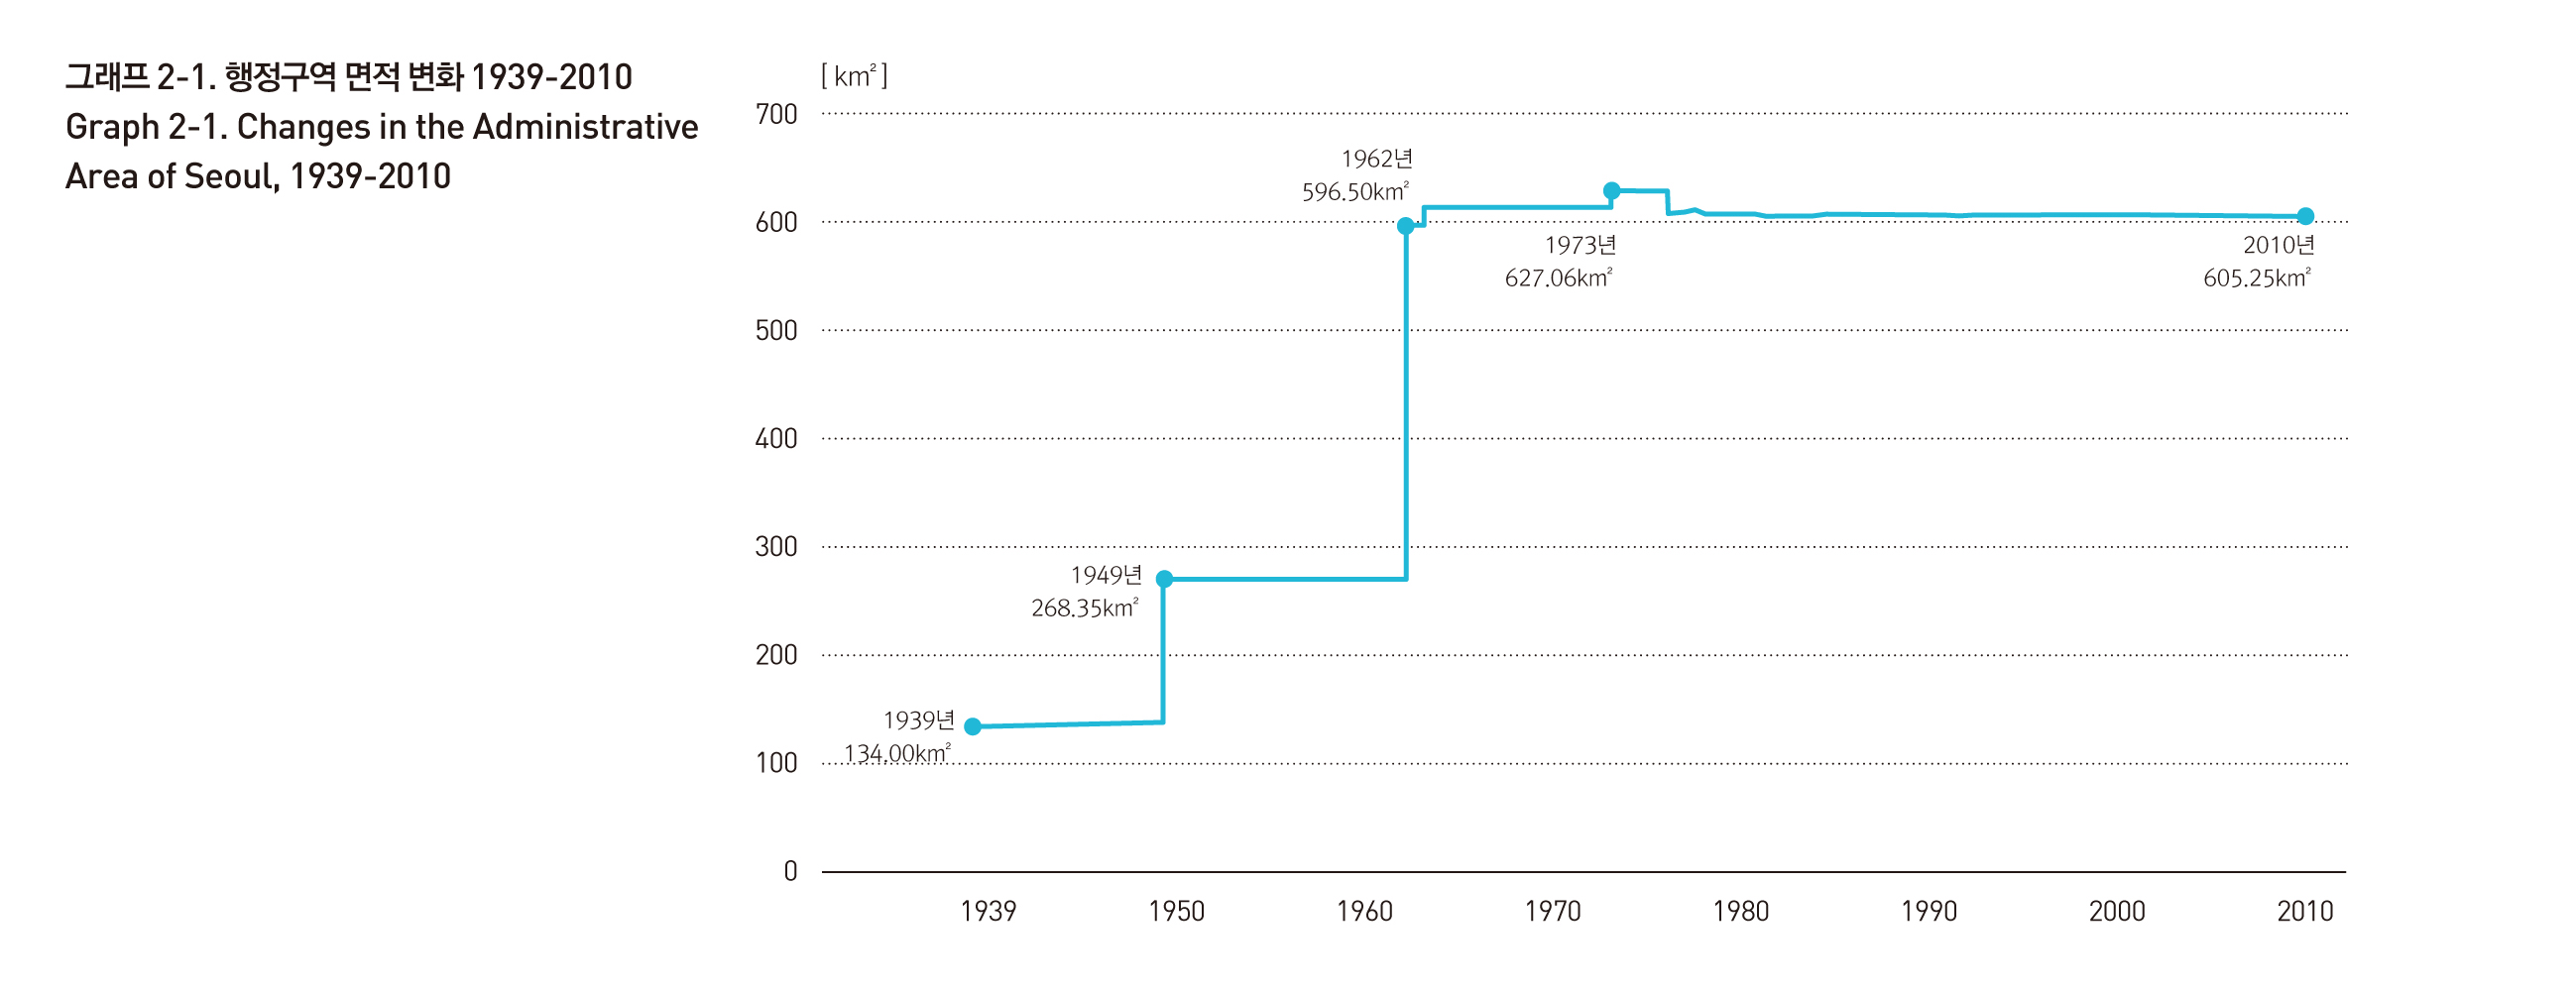
Seoul underwent the first massive expansion of administrative area in 1939, during the late Japanese colonial period, when suburban area of the city was expanded to 134㎢, with the development and integration of yeongdeungpo area as a Japanese military industrial complex. Seoul's administrative area grew further after independence, when it was promoted and renamed as Seoul metropolitan City in 1949 and expanded to 268.35㎢.
Since then, the administrative area of Seoul expanded into nearby regions in gyeonggi-do, as the total area grew by 2.3 times to 613.04㎢ in 1963, and to 627.06㎢ in 1973. After the creation of new districts and further surveys, the area of Seoul scaled back to 605.25㎢, as of late 2010.
Source: The Social Maps of Seoul in The Seoul Research Data Service http://data.si.re.kr/map-seoul-2013
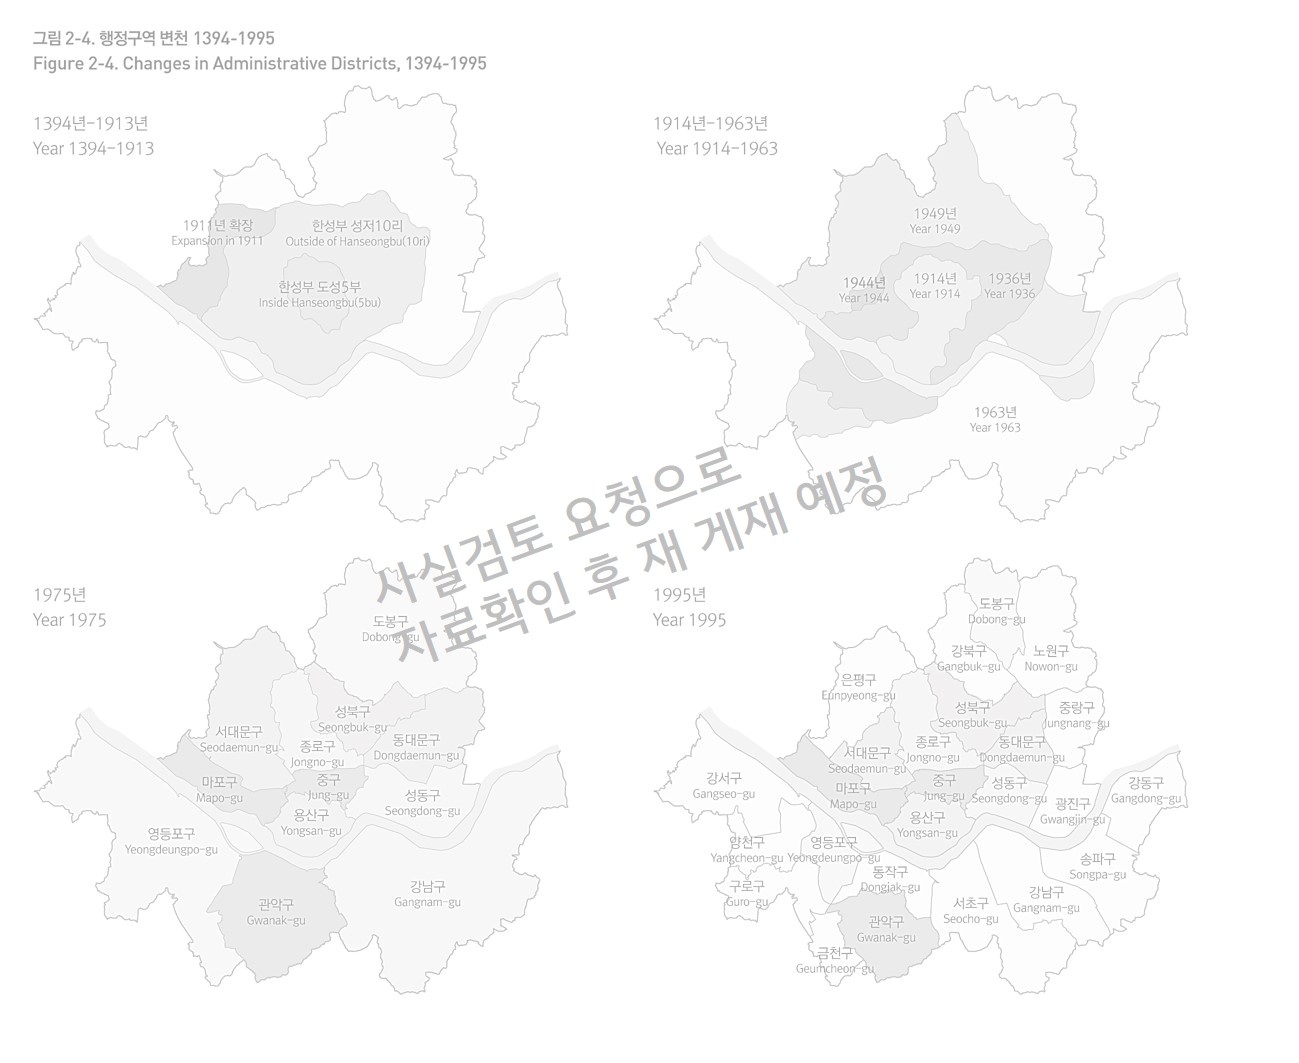
Four maps above will be renewed after additional verification.
Origin : Seoul Institute, 지도로 본 서울 2007
Source: The Social Maps of Seoul in The Seoul Research Data Service http://data.si.re.kr/map-seoul-2013
Origin : 경제기획원, 한국통계연감
Seoul Metropolitan Government, Seoul Statistics
Source: The Social Maps of Seoul in The Seoul Research Data Service http://data.si.re.kr/map-seoul-2013
ADMINISTRATIVE DISTRICTS
Ever since it was renamed to Seoul Metropolitan Government in 1949, Seoul underwent many changes in its administrative districts. To the 7 original districts, 18 other districts were further added to the city in 1995, placing the total count of administrative districts at 25. With the installment and discontinuance of certain administrative neighborhoods, there are now, as of 2010, 25 districts and 424 administrative neighborhoods in Seoul. Administrative neighborhoods (dong) are units designated for administrative convenience and have always come and gone with the growth and decline of local populations. Legal neighborhoods (dong), however, rarely undergo changes in their status. As of 2010, there are 467 legal neighborhoods in Seoul.
Source: The Social Maps of Seoul in The Seoul Research Data Service http://data.si.re.kr/map-seoul-2013
.jpg)
Origin : 통계청, 통계지리정보(SGIS), 2010년
Source: The Social Maps of Seoul in The Seoul Research Data Service http://data.si.re.kr/map-seoul-2013
.jpg)
Origin : 행정안전부, 새주소 시스템 기본도, 2010년
Source: The Social Maps of Seoul in The Seoul Research Data Service http://data.si.re.kr/map-seoul-2013
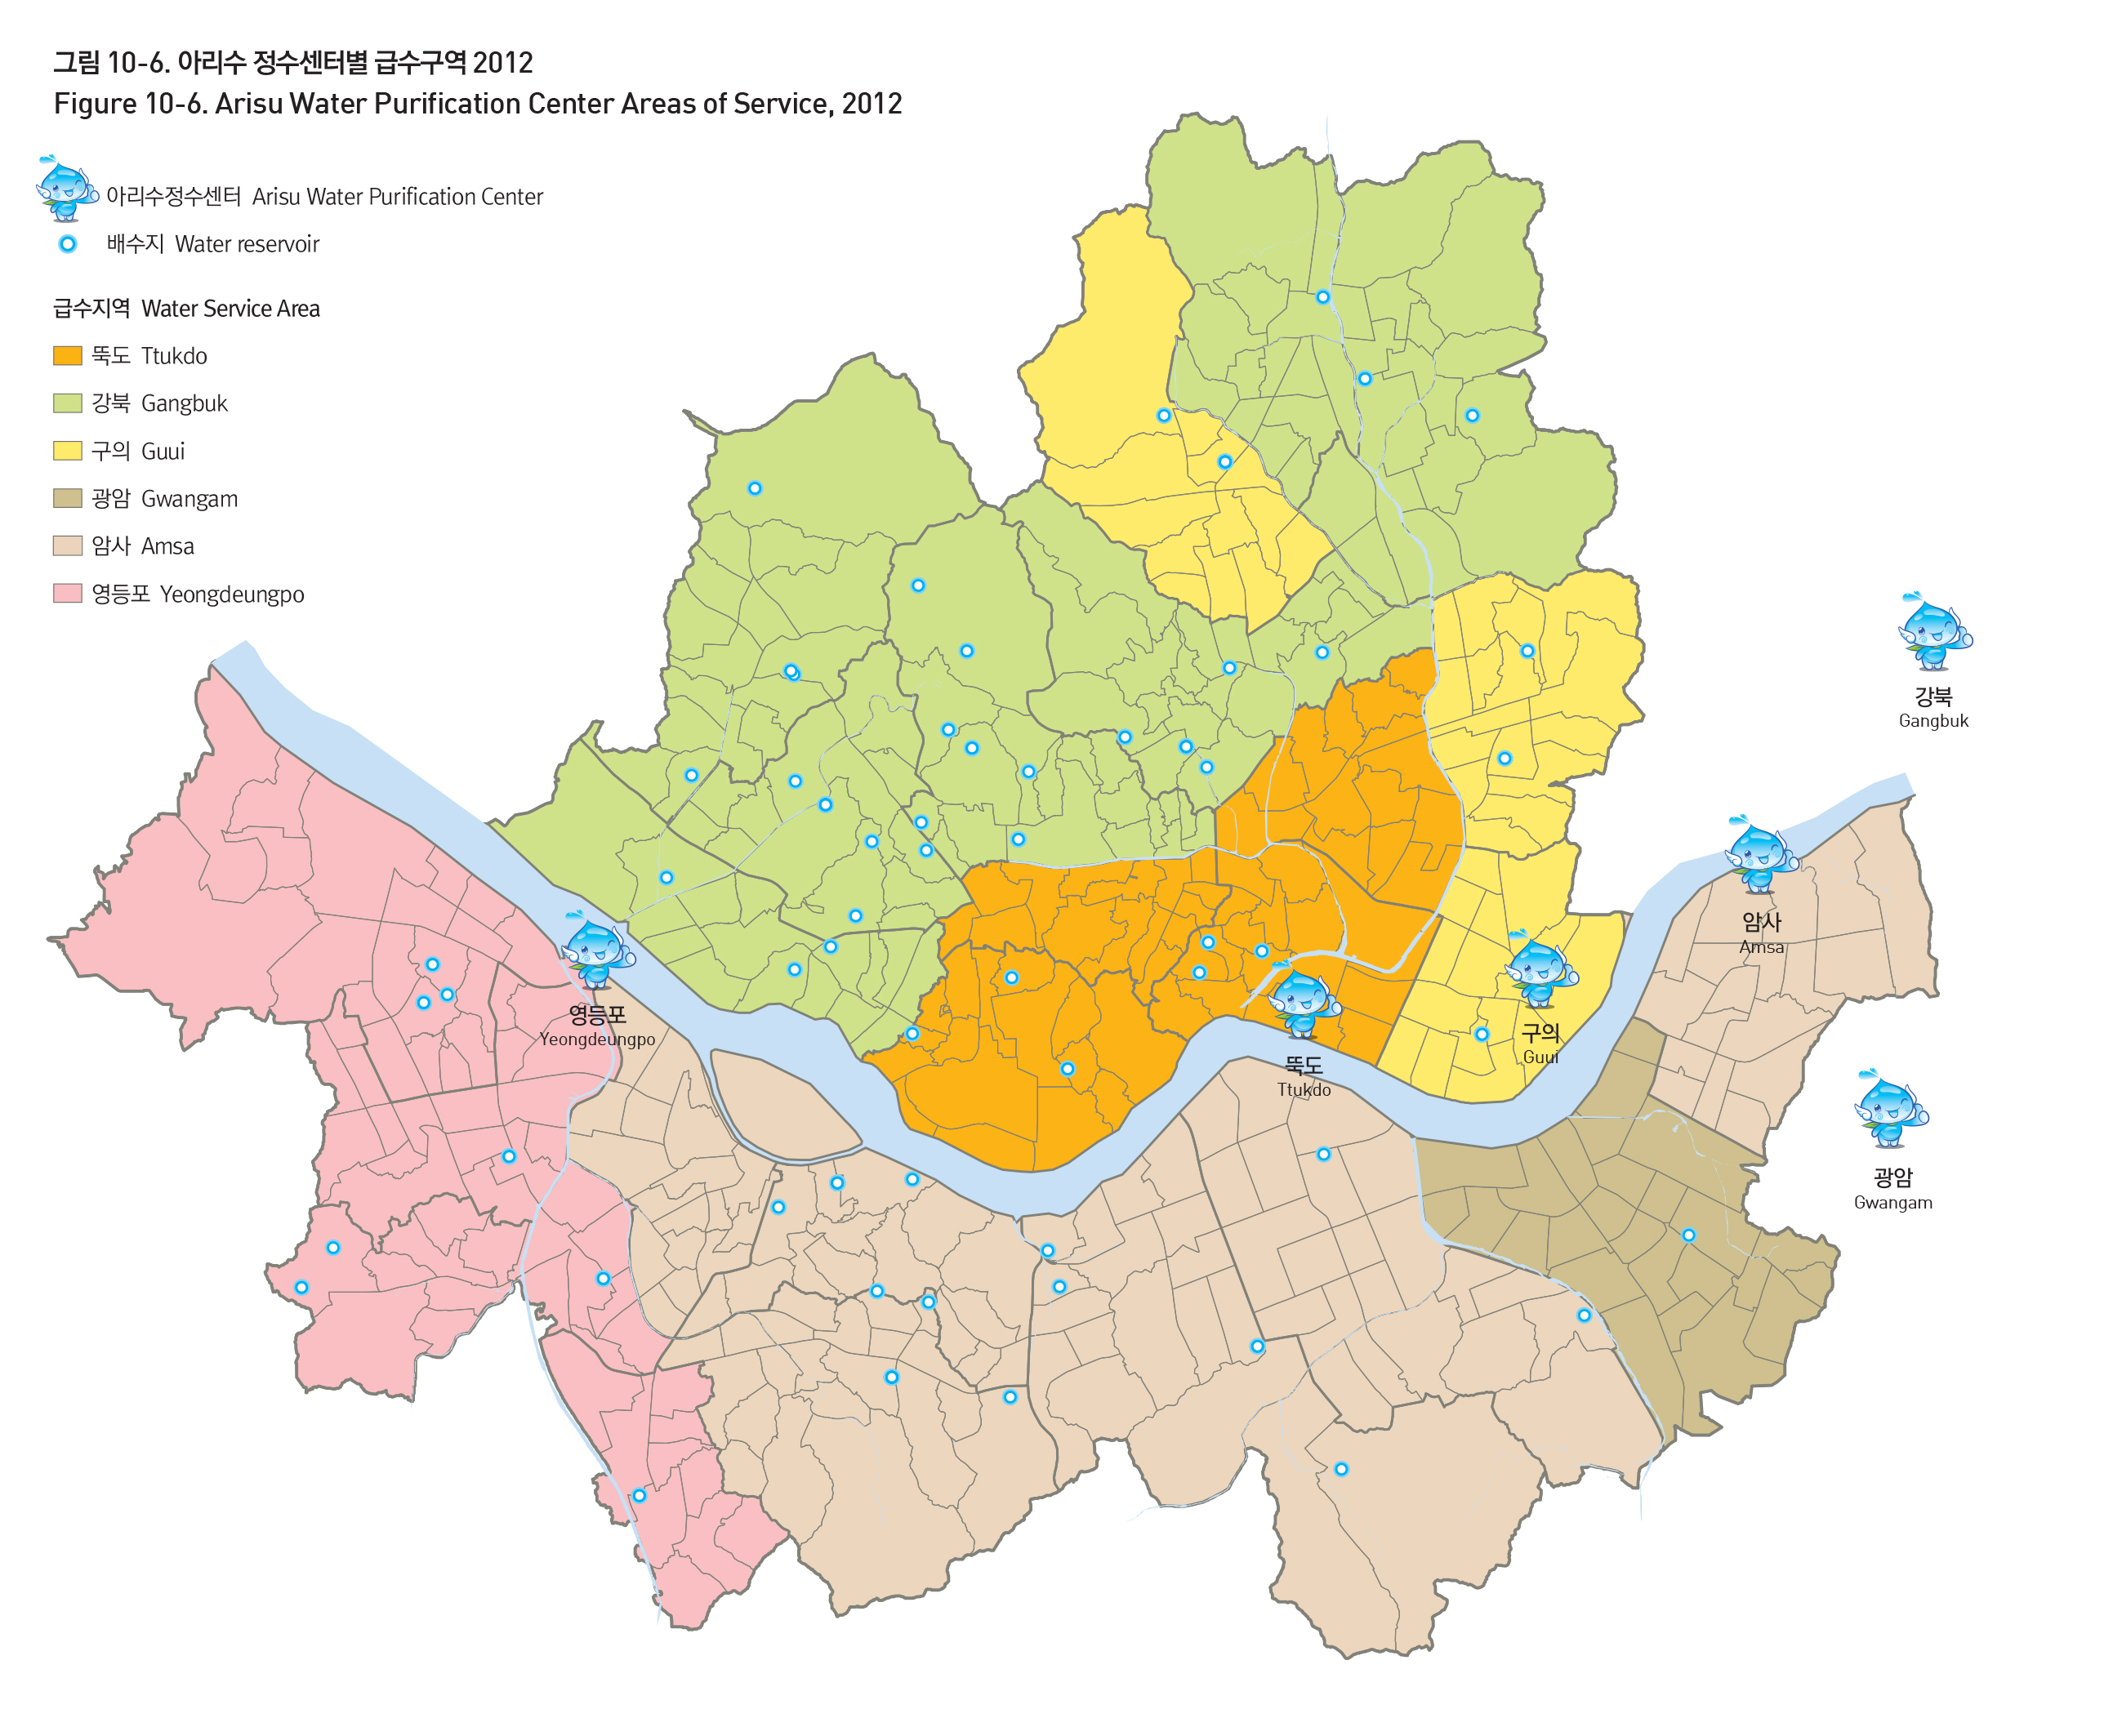
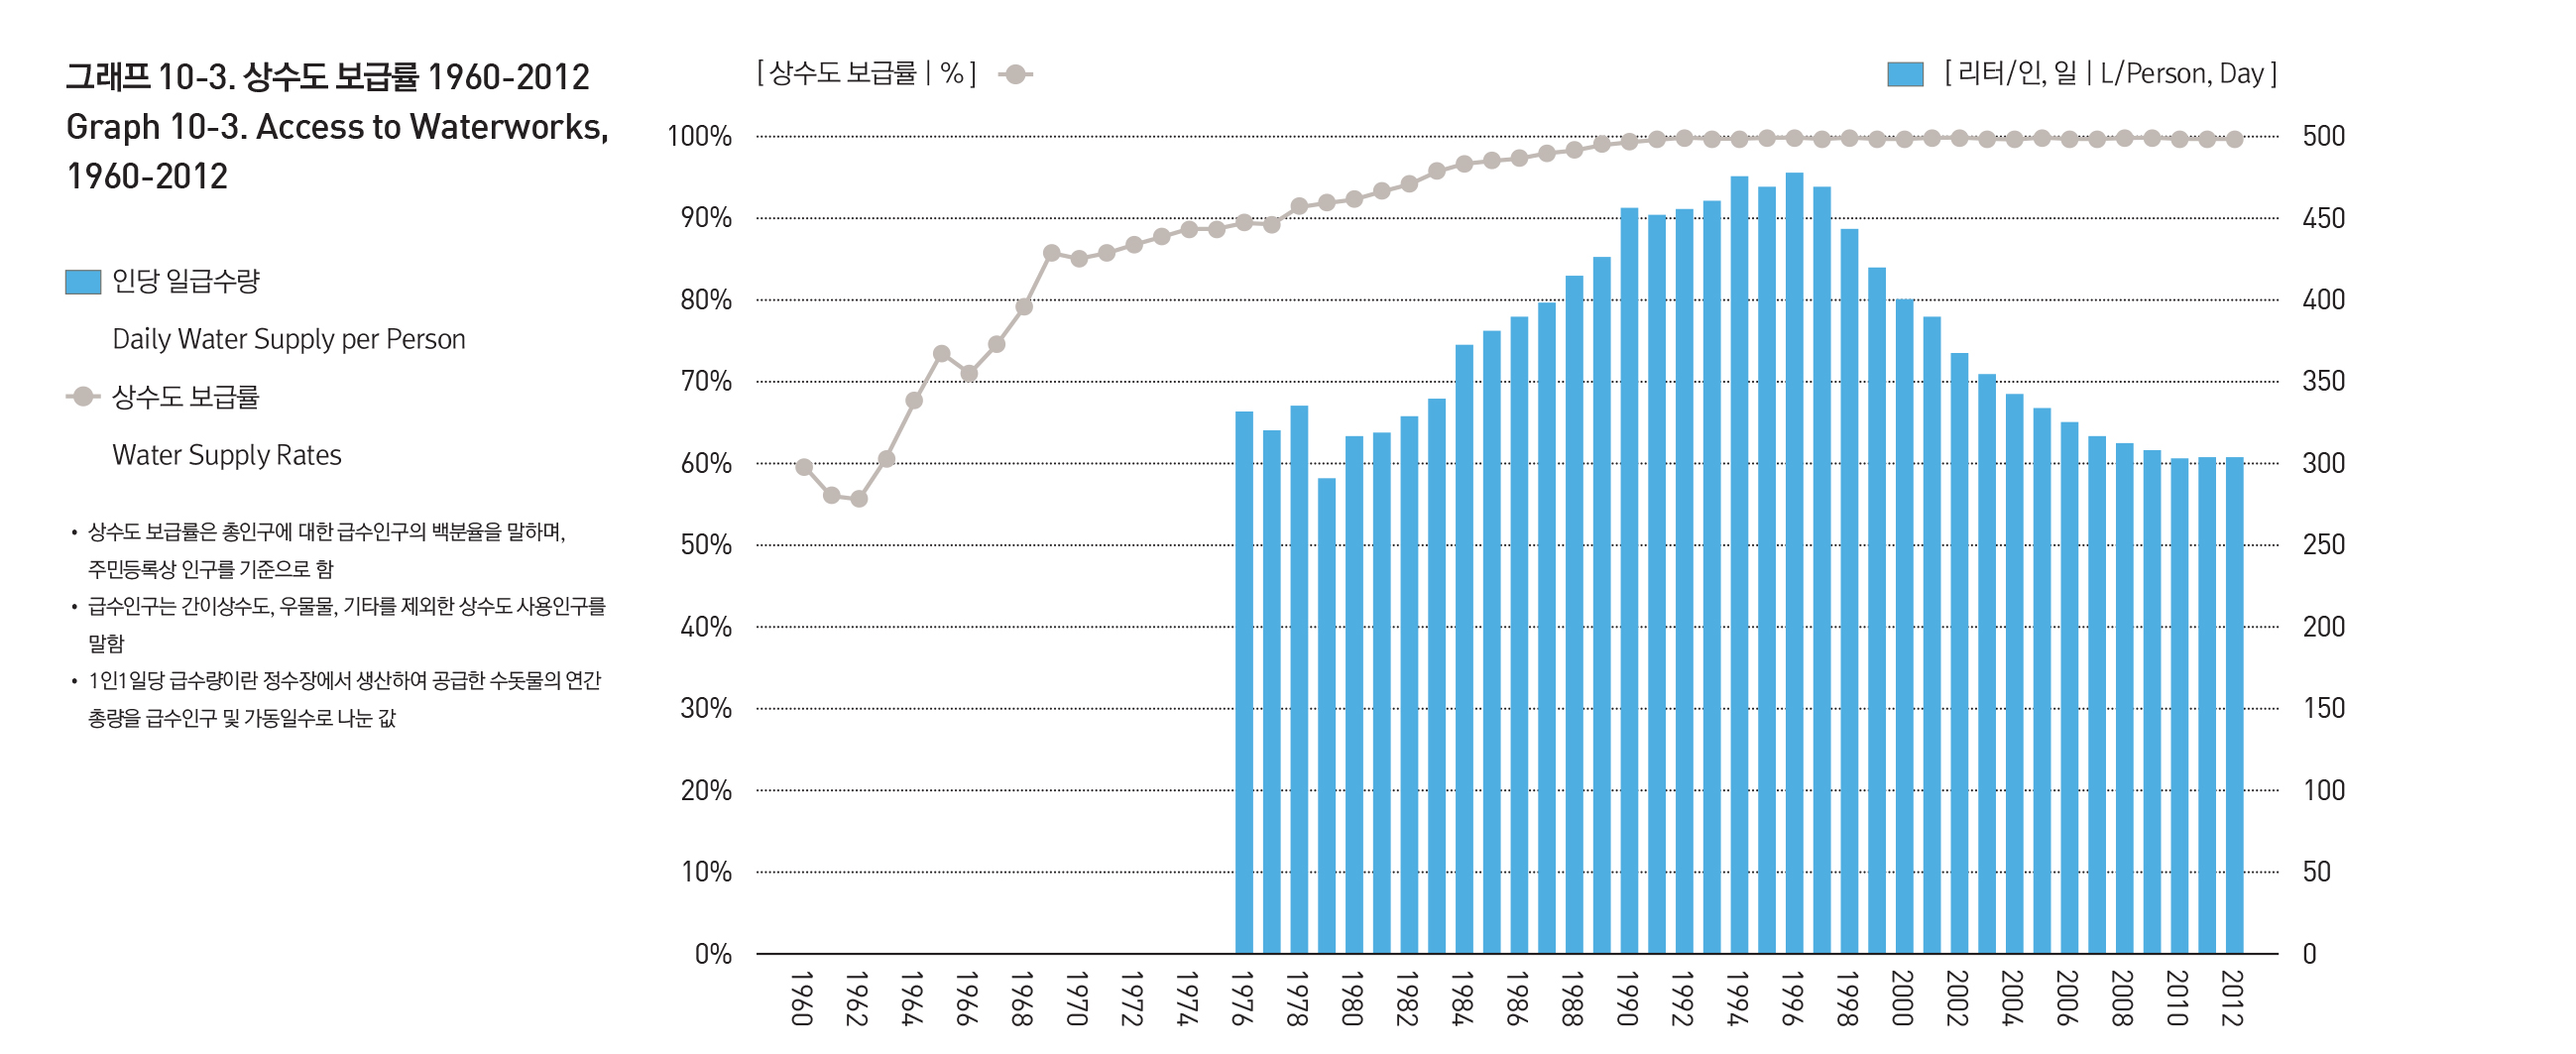
WATERWORKS
Seoul's first modern waterworks system derives from a private Japanese-built system in the Japanese boroughs and was officially launched in 1908. After the 1960s, access to waterworks increased gradually and increased to nearly 100% in the 1990s.
The improvement in waterworks accessibility was due to the construction of water treatment plants and the expansion of the water pipe system. In the late 1970s, the capacity of Seoul's waterworks plants was only 2 million tons. While facility capacities were around 2 million tons in the late 1970s, they rose to about 7.3 million tons in 1999, before scaling back and maintaining the current levels of about 4.35 million tons as of 2012.
Source: The Social Maps of Seoul in The Seoul Research Data Service http://data.si.re.kr/map-seoul-2013
Origin : Seoul Metropolitan Government, 상수도사업본부
Source: The Social Maps of Seoul in The Seoul Research Data Service http://data.si.re.kr/map-seoul-2013
Origin : Seoul Metropolitan Government, Seoul Statistics
Source: The Social Maps of Seoul in The Seoul Research Data Service http://data.si.re.kr/map-seoul-2013
표 10-1 정수장 현황 2012
| 정수장 | 시설용량 | 생산량 | 평균가동률 |
|---|---|---|---|
| 광암 | 400 | 221 | 55.2 |
| 구의 | 250 | 192 | 76.9 |
| 뚝도 | 500 | 405 | 80.9 |
| 영등포 | 600 | 444 | 74.0 |
| 암사 | 1600 | 1,152 | 72.0 |
| 강북 | 1000 | 811 | 81.0 |
| 계 | 4350 | 3,225 | 74.1 |
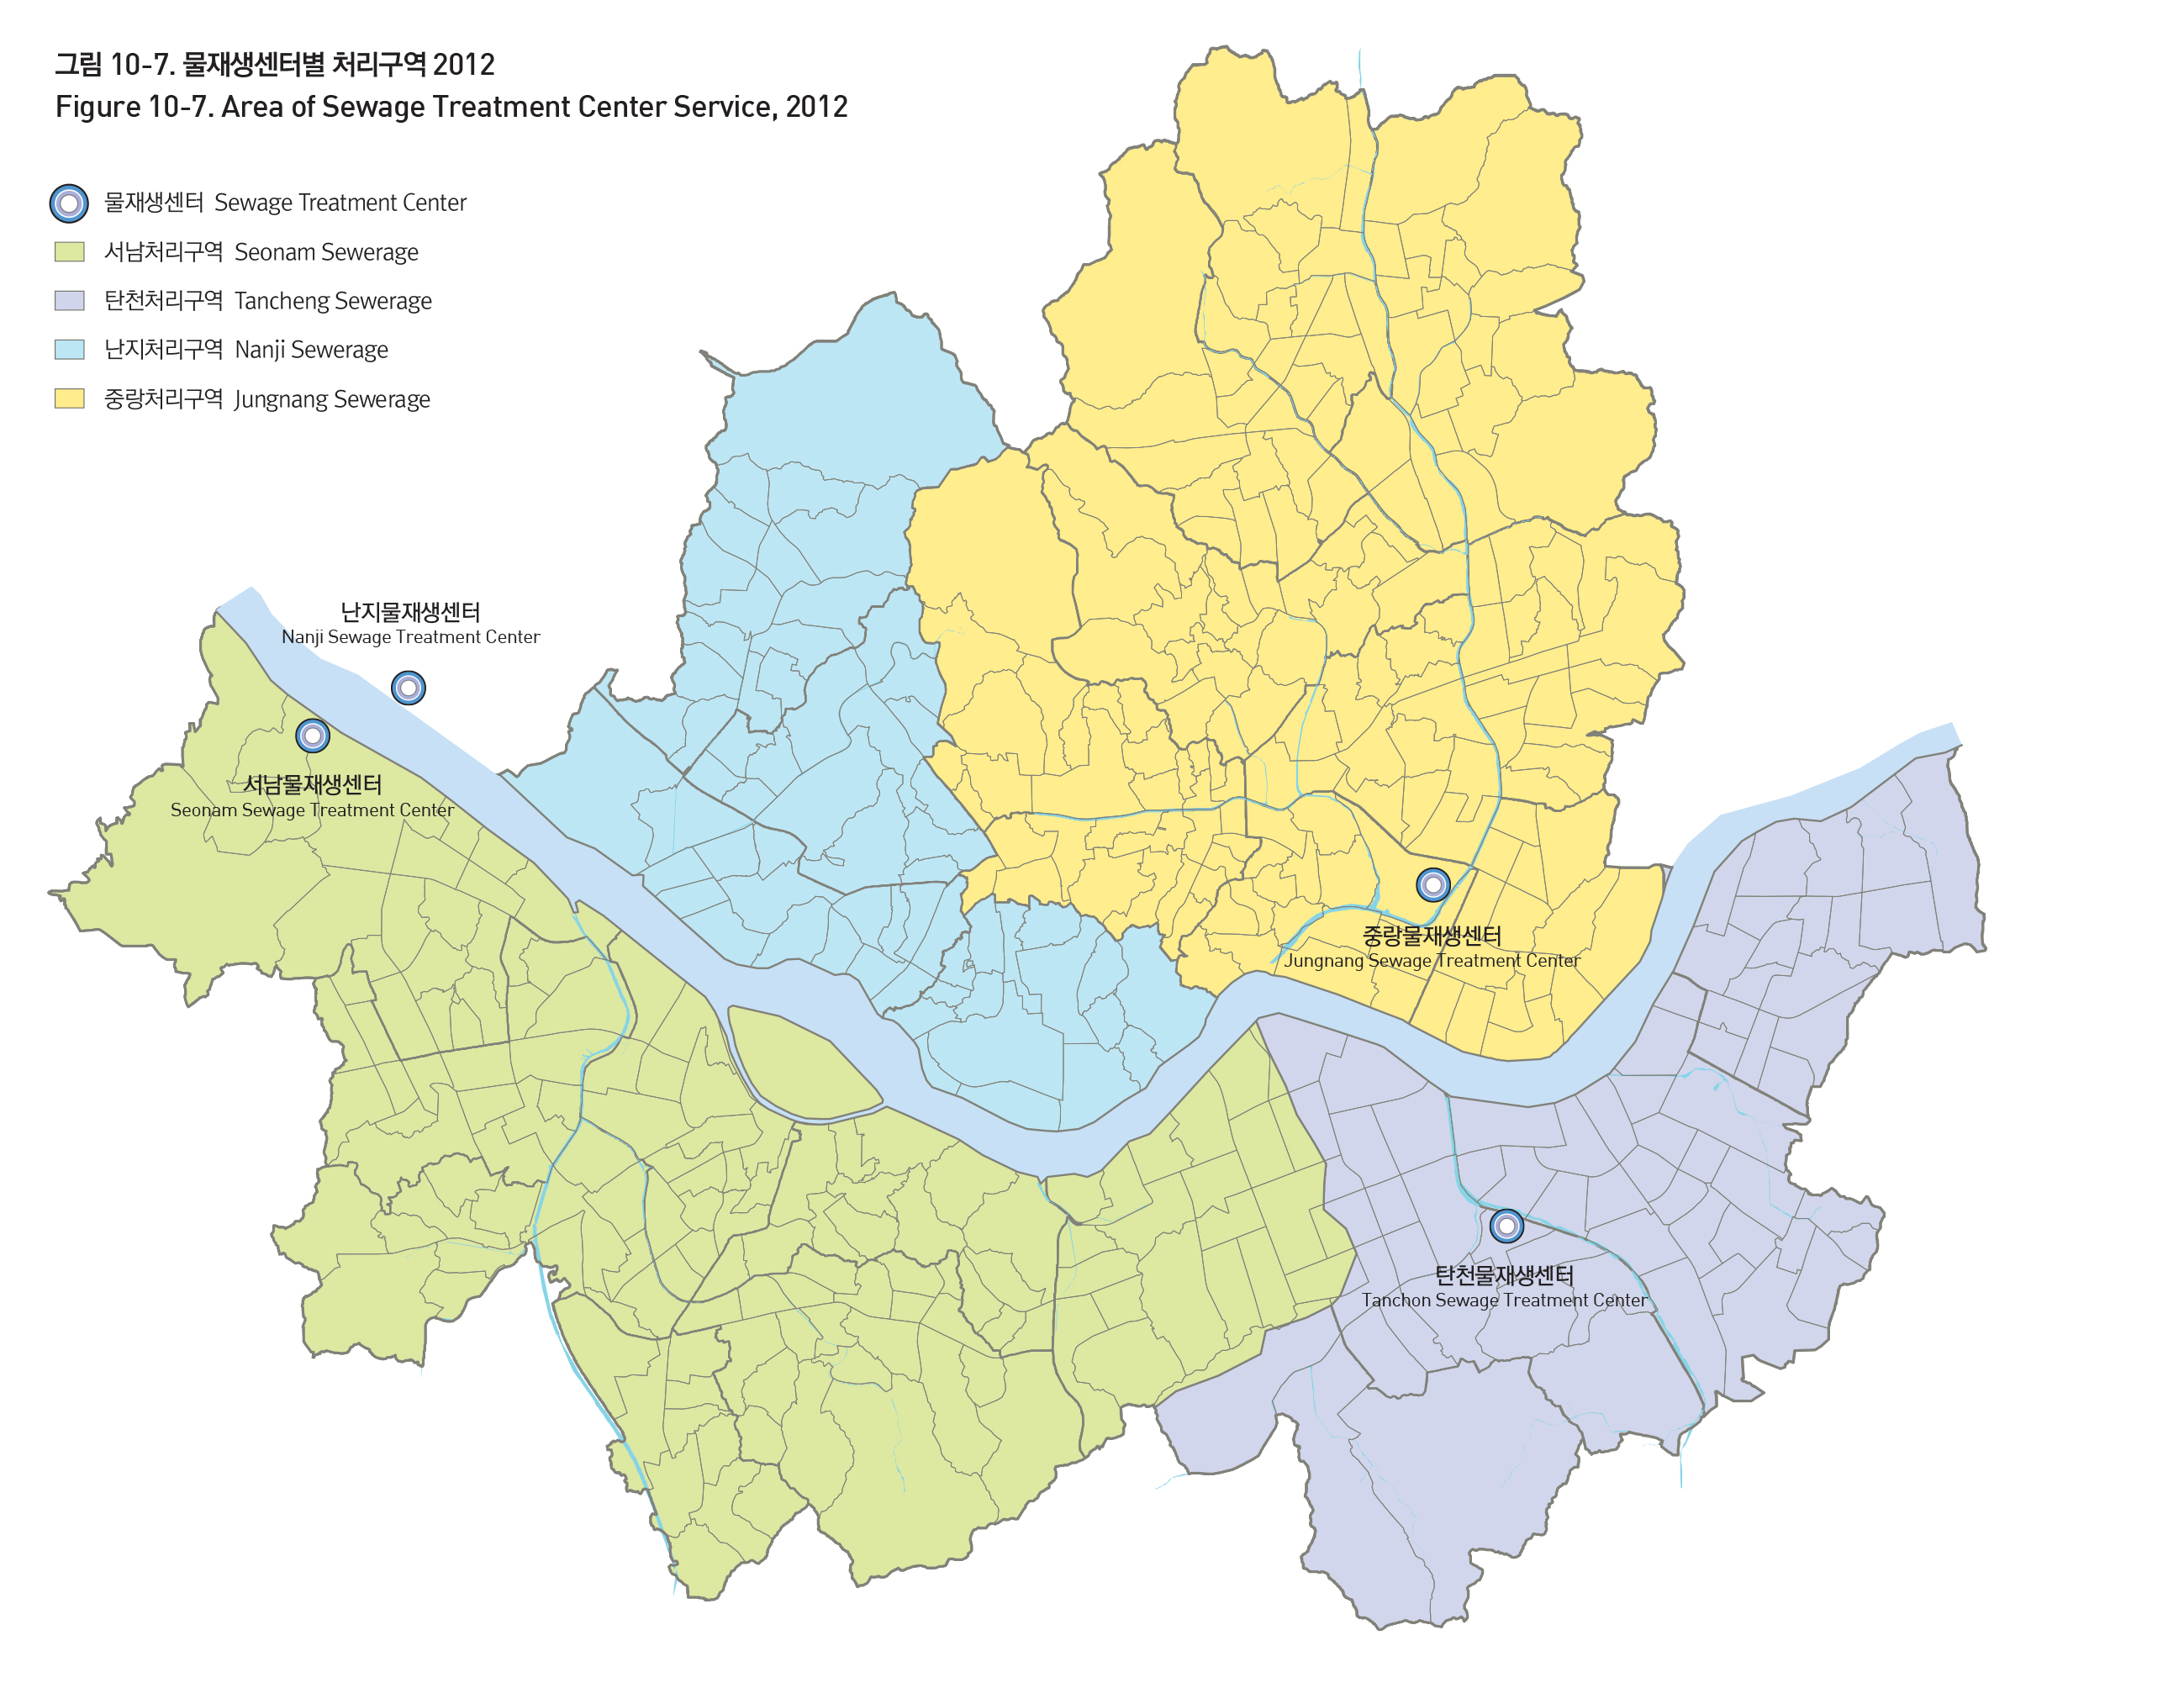
SEWERAGE
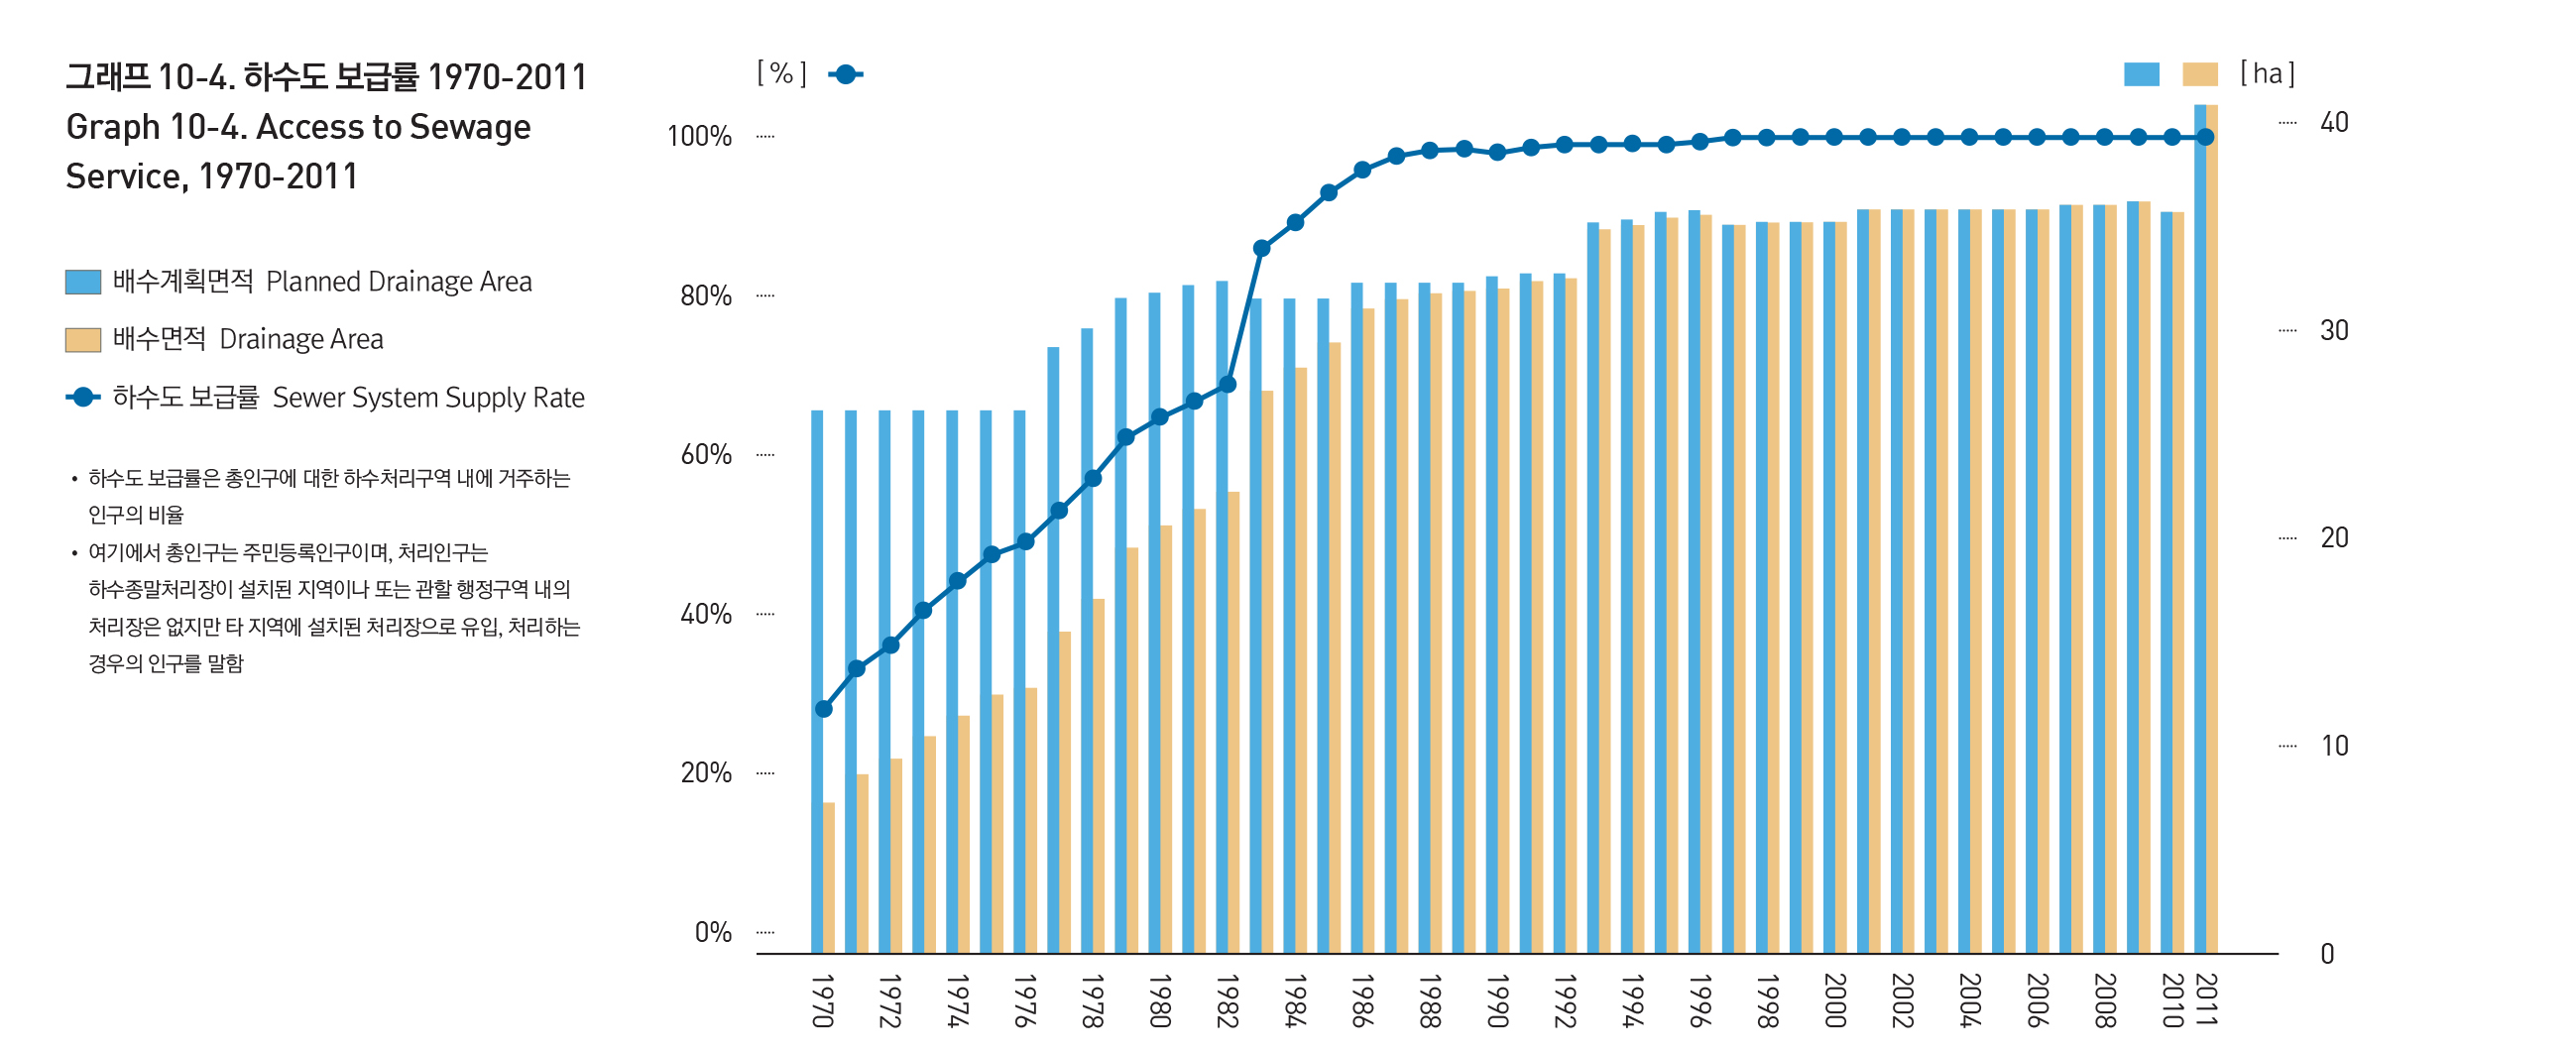
In 1976, Seoul constructed the Cheonggye Sewage Treatment Center (with the treatment capacity of 150,000 tons per day) in order to address the increasing problems associated with water pollution in public waters. A full system for sewage treatment was launched in Seoul in 1988. Today all residents in Seoul have access to sewage, serviced by 4 water water treatment centers in Jungnang, Tancheon, Seonam, and Nanji, treating 5.81 million tons of sewage and excrements in their respective regions everyday. In the 1970s, sewage services were available to only 27.9% of the population. It was only in 1977 that sewage access exceeded 50%. From then, sewage systems developed rapidly, reaching 100% in 1997.
Source: The Social Maps of Seoul in The Seoul Research Data Service http://data.si.re.kr/map-seoul-2013
Origin : Seoul Metropolitan Government 홈페이지(환경•공원 •상수도)
Source: The Social Maps of Seoul in The Seoul Research Data Service http://data.si.re.kr/map-seoul-2013
Origin : Seoul Metropolitan Government, Seoul Statistics
Source: The Social Maps of Seoul in The Seoul Research Data Service http://data.si.re.kr/map-seoul-2013
표 10-2 물재생센터 현황 2012
| 물재생센터 | 시설용량 | 처리량 | 연계처리량 |
|---|---|---|---|
| 중랑물재생센터 | 1,710 | 1,344 | 3,643 |
| 탄천물재생센터 | 1,100 | 794 | 68 |
| 서남물재생센터 | 2,000 | 1,662 | 2,863 |
| 난지물재생센터 | 1,000 | 620 | 6,350 |
| 합계 | 5,810 | 4,420 | 12,924 |
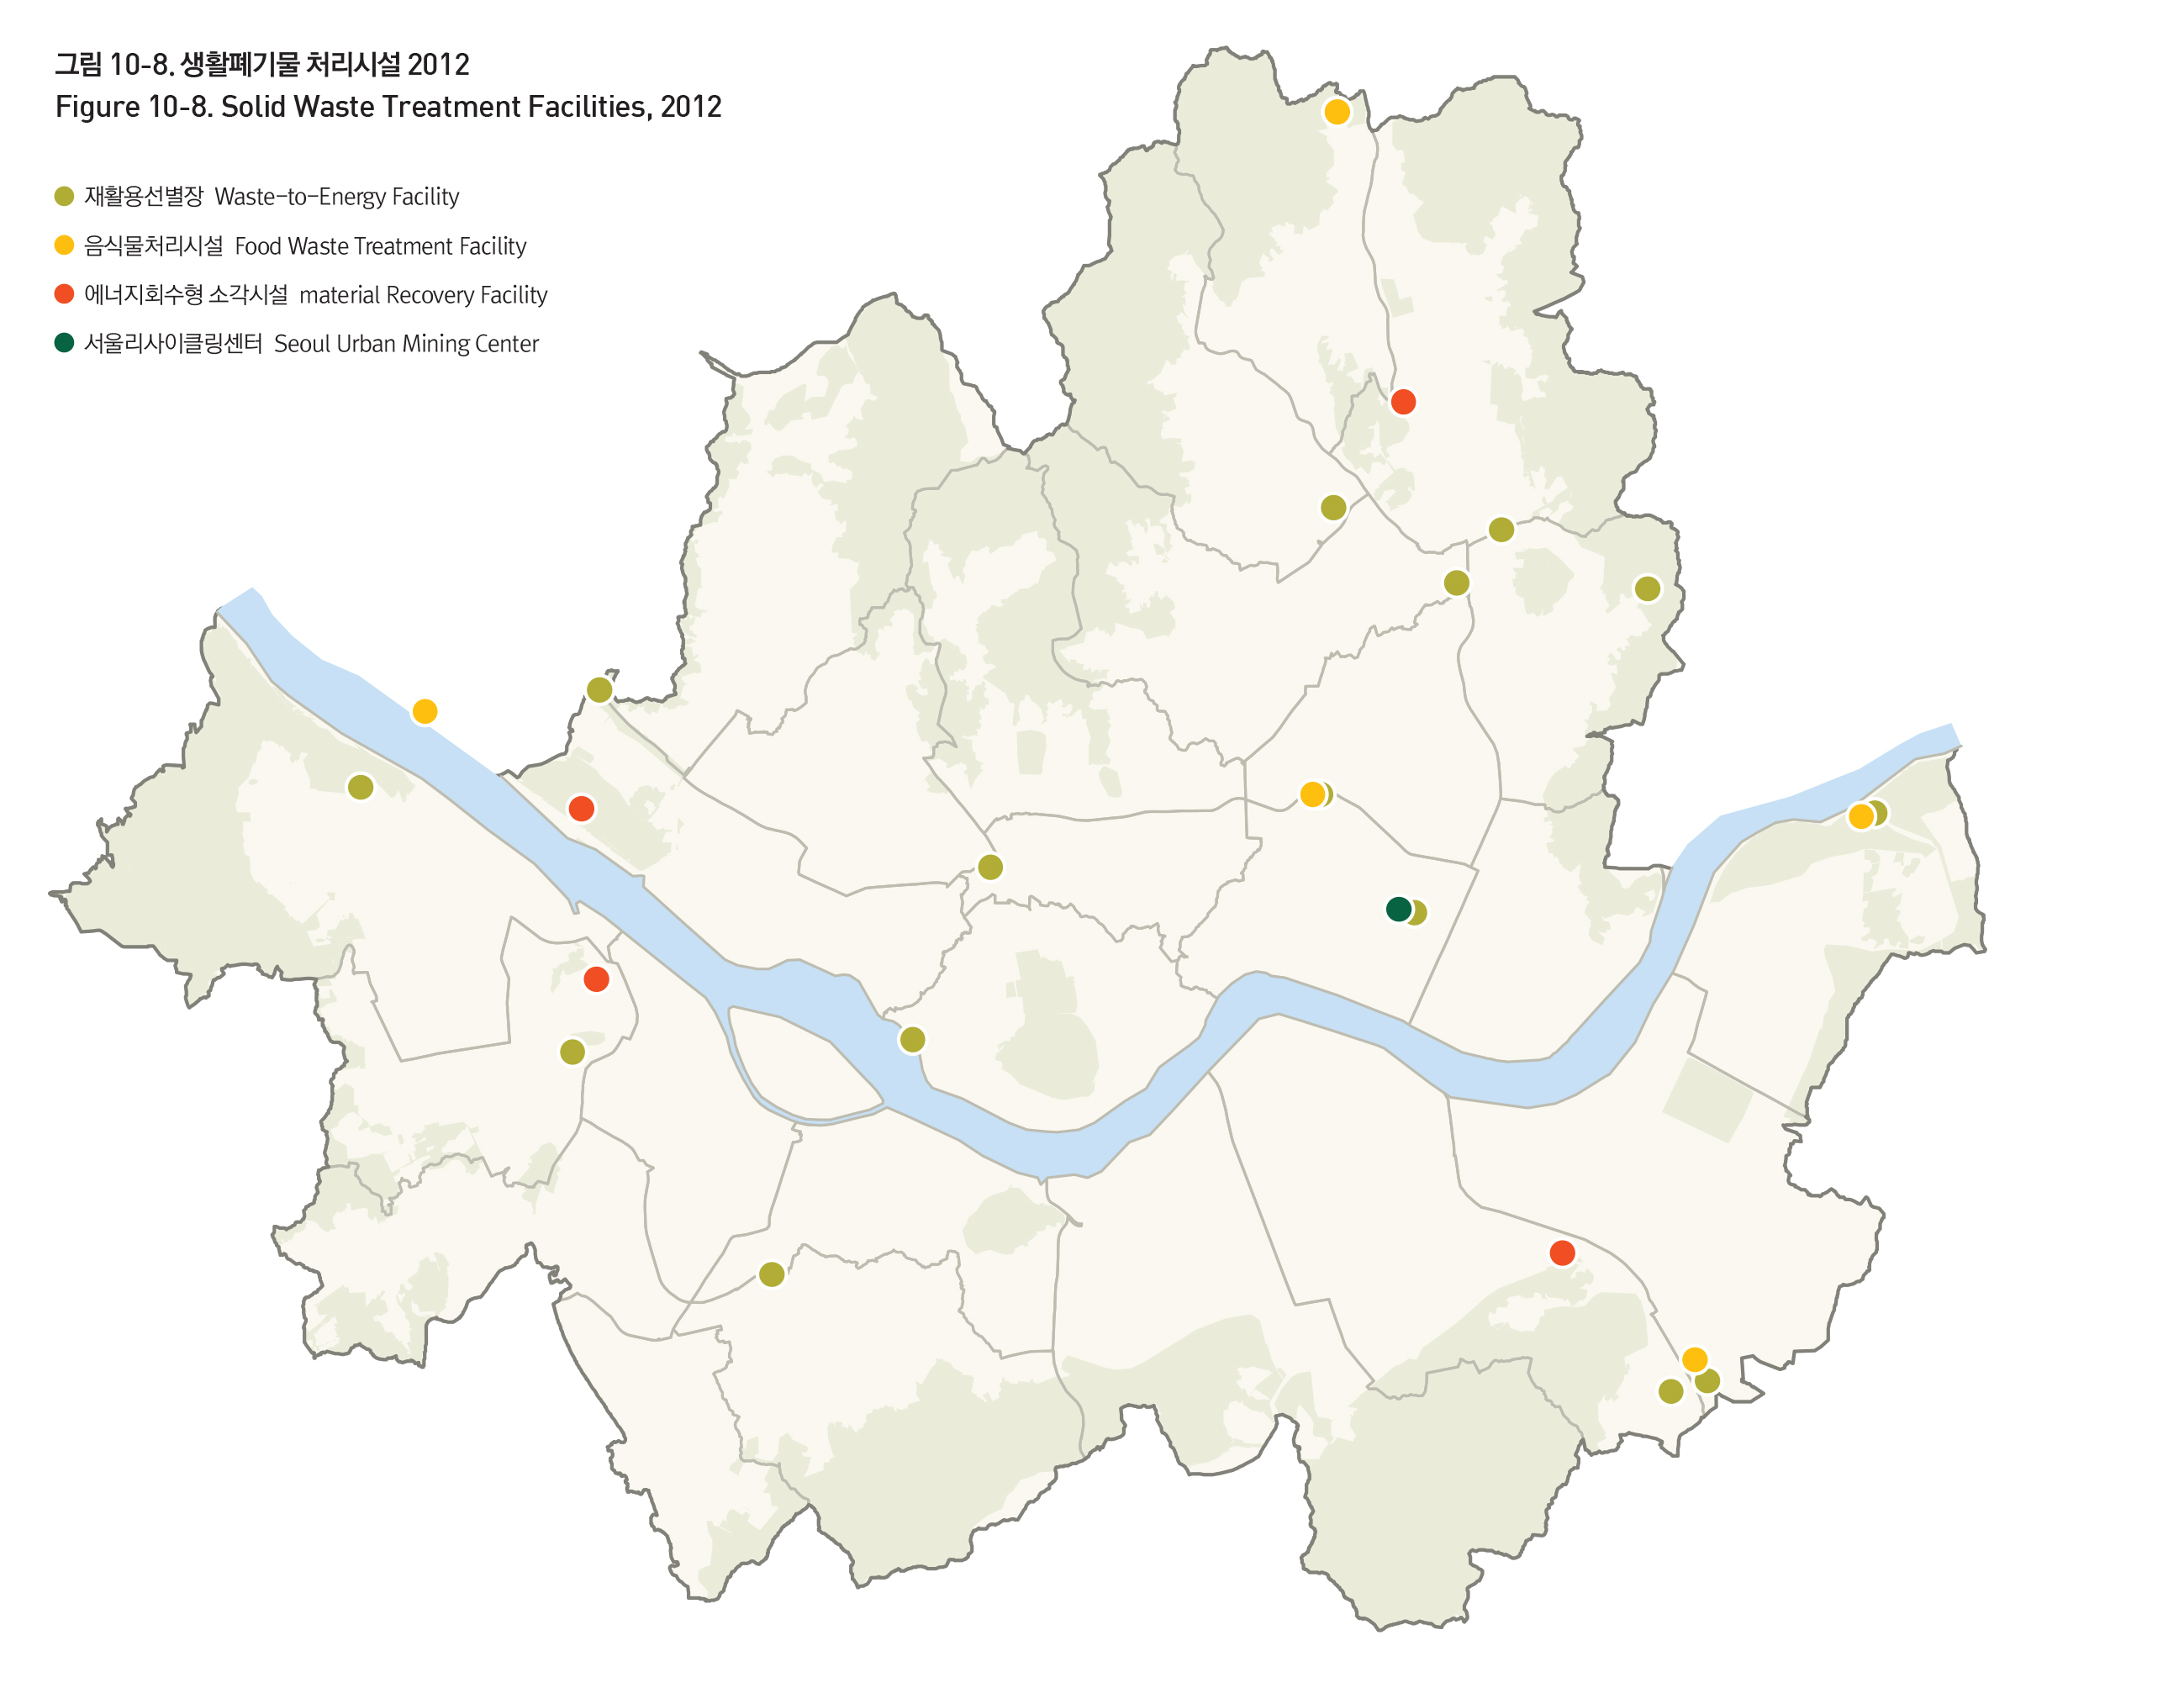
MUNICIPAL SOLID WASTES
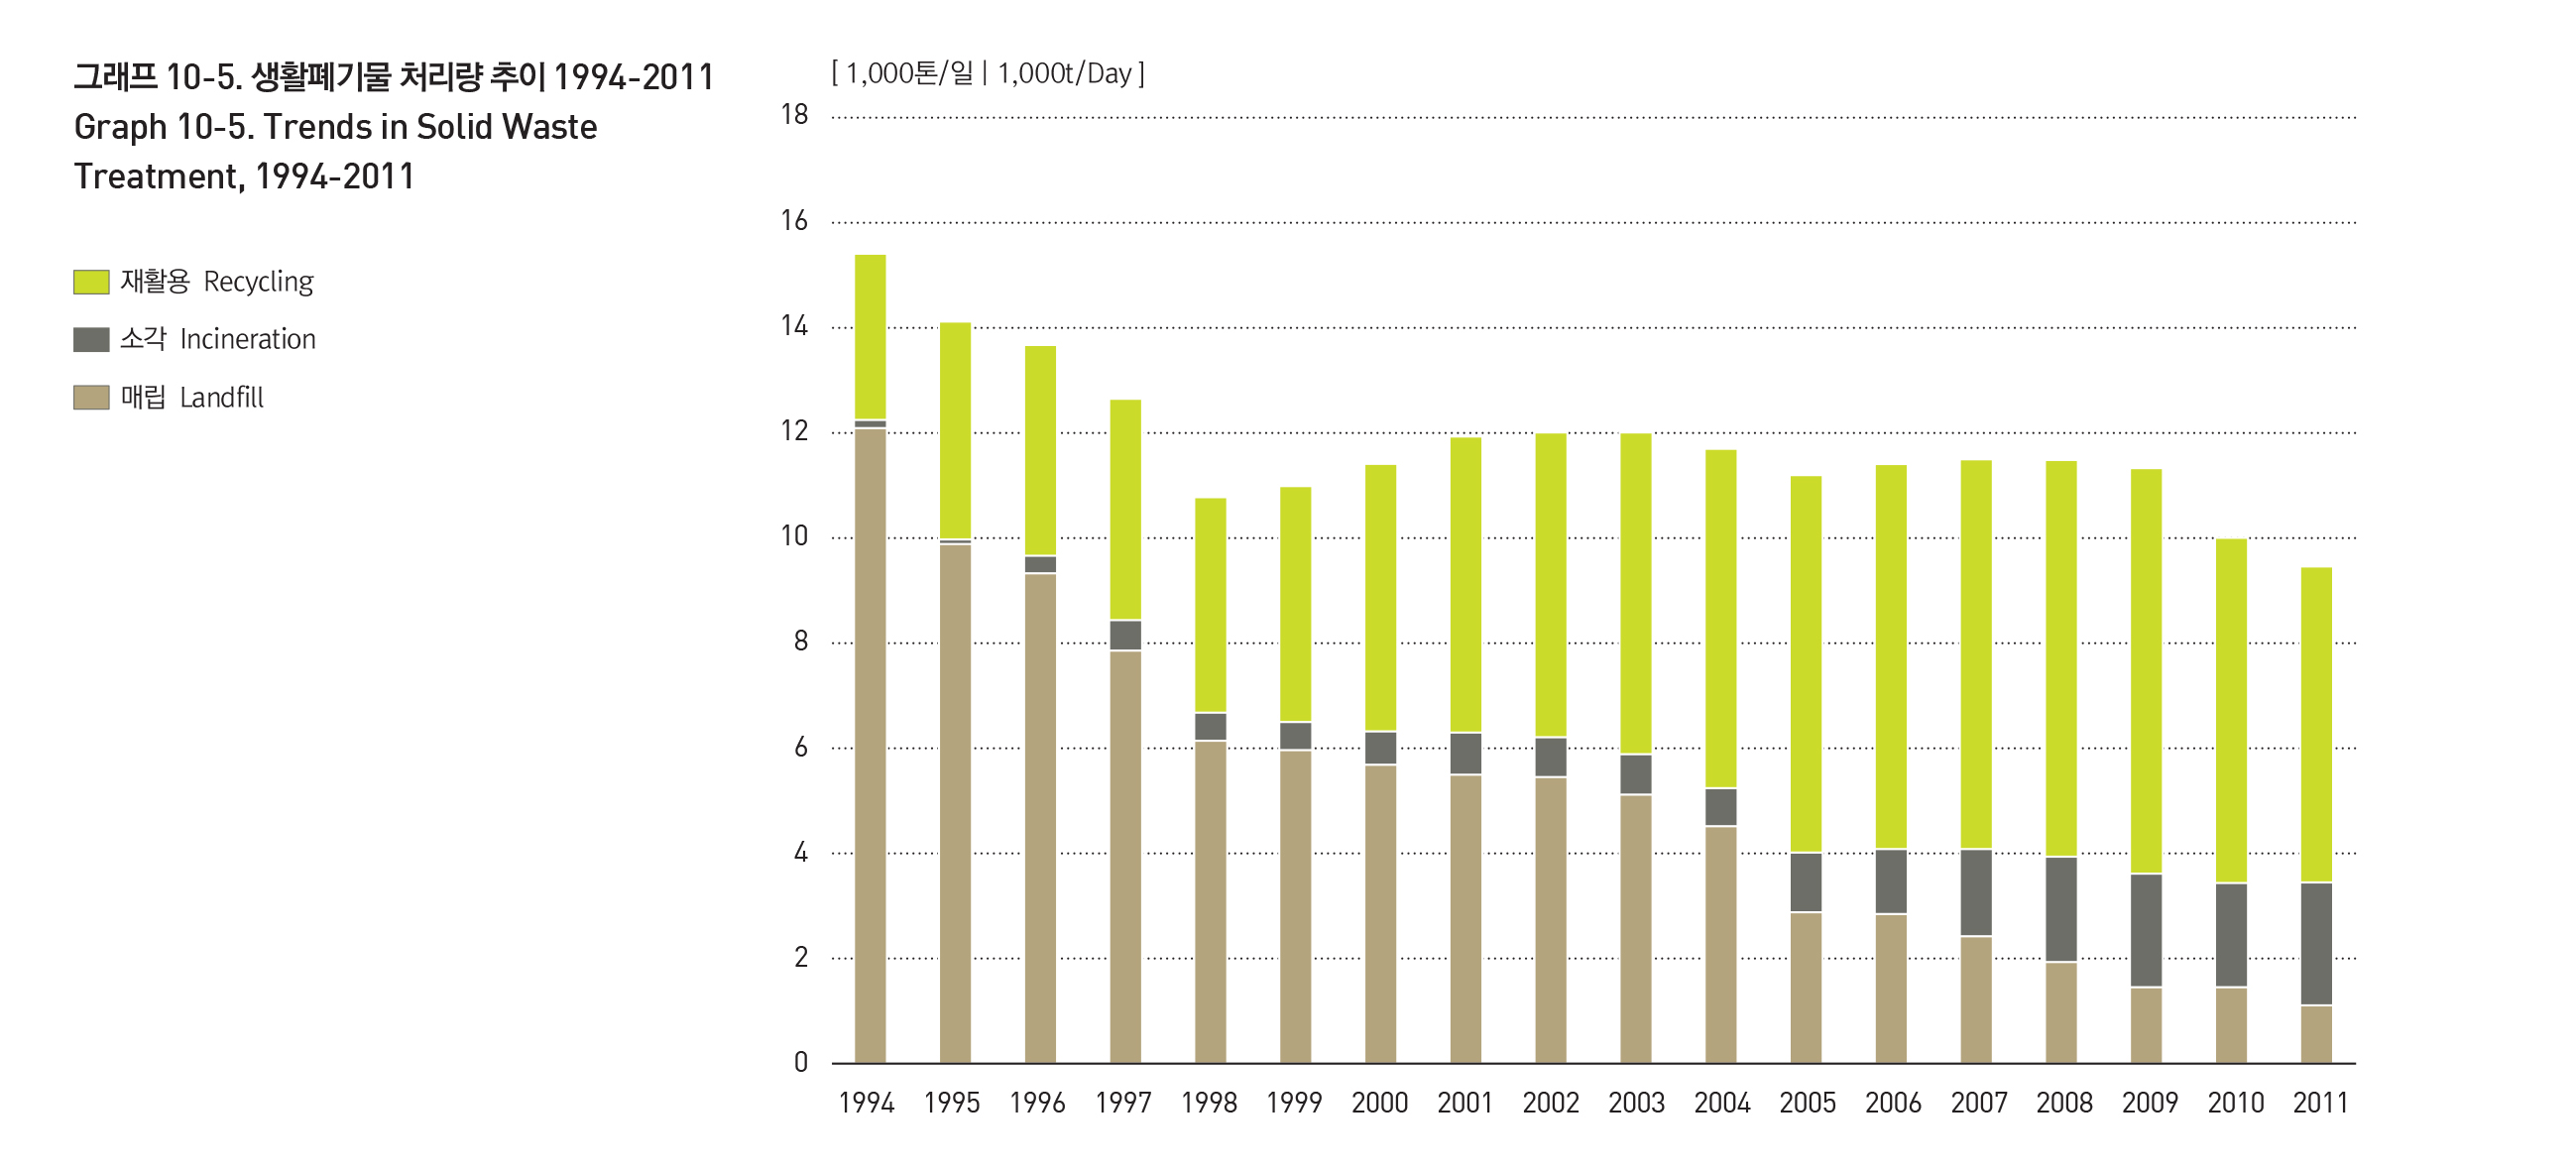
As of 2011, 9,440 tons of solid wastes are produced in Seoul everyday. The amount of solid wastes has generally reduced in the past 20 years, the installment of a volume-based waste fee system in 1995 and the IMF crisis in 1998 being important factors in the scaleback. The major methods of waste treatment include recycling (63.5%), waste-to-energy incineration (24.8%) and landfill (11.7%). They are serviced by 4 public waste-to-energy incineration facilitiess, 5 food waste treatment facilities, 15 material recovery facilities, and Seoul Urban Mining Center.
Source: The Social Maps of Seoul in The Seoul Research Data Service http://data.si.re.kr/map-seoul-2013
Origin : Seoul Metropolitan Government, 도시계획정보관리시스템(UPIS),도시계획시설, 2012년
Source: The Social Maps of Seoul in The Seoul Research Data Service http://data.si.re.kr/map-seoul-2013
Origin : Seoul Metropolitan Government, Seoul Statistics
Seoul Metropolitan Government 자원회수시설
Source: The Social Maps of Seoul in The Seoul Research Data Service http://data.si.re.kr/map-seoul-2013
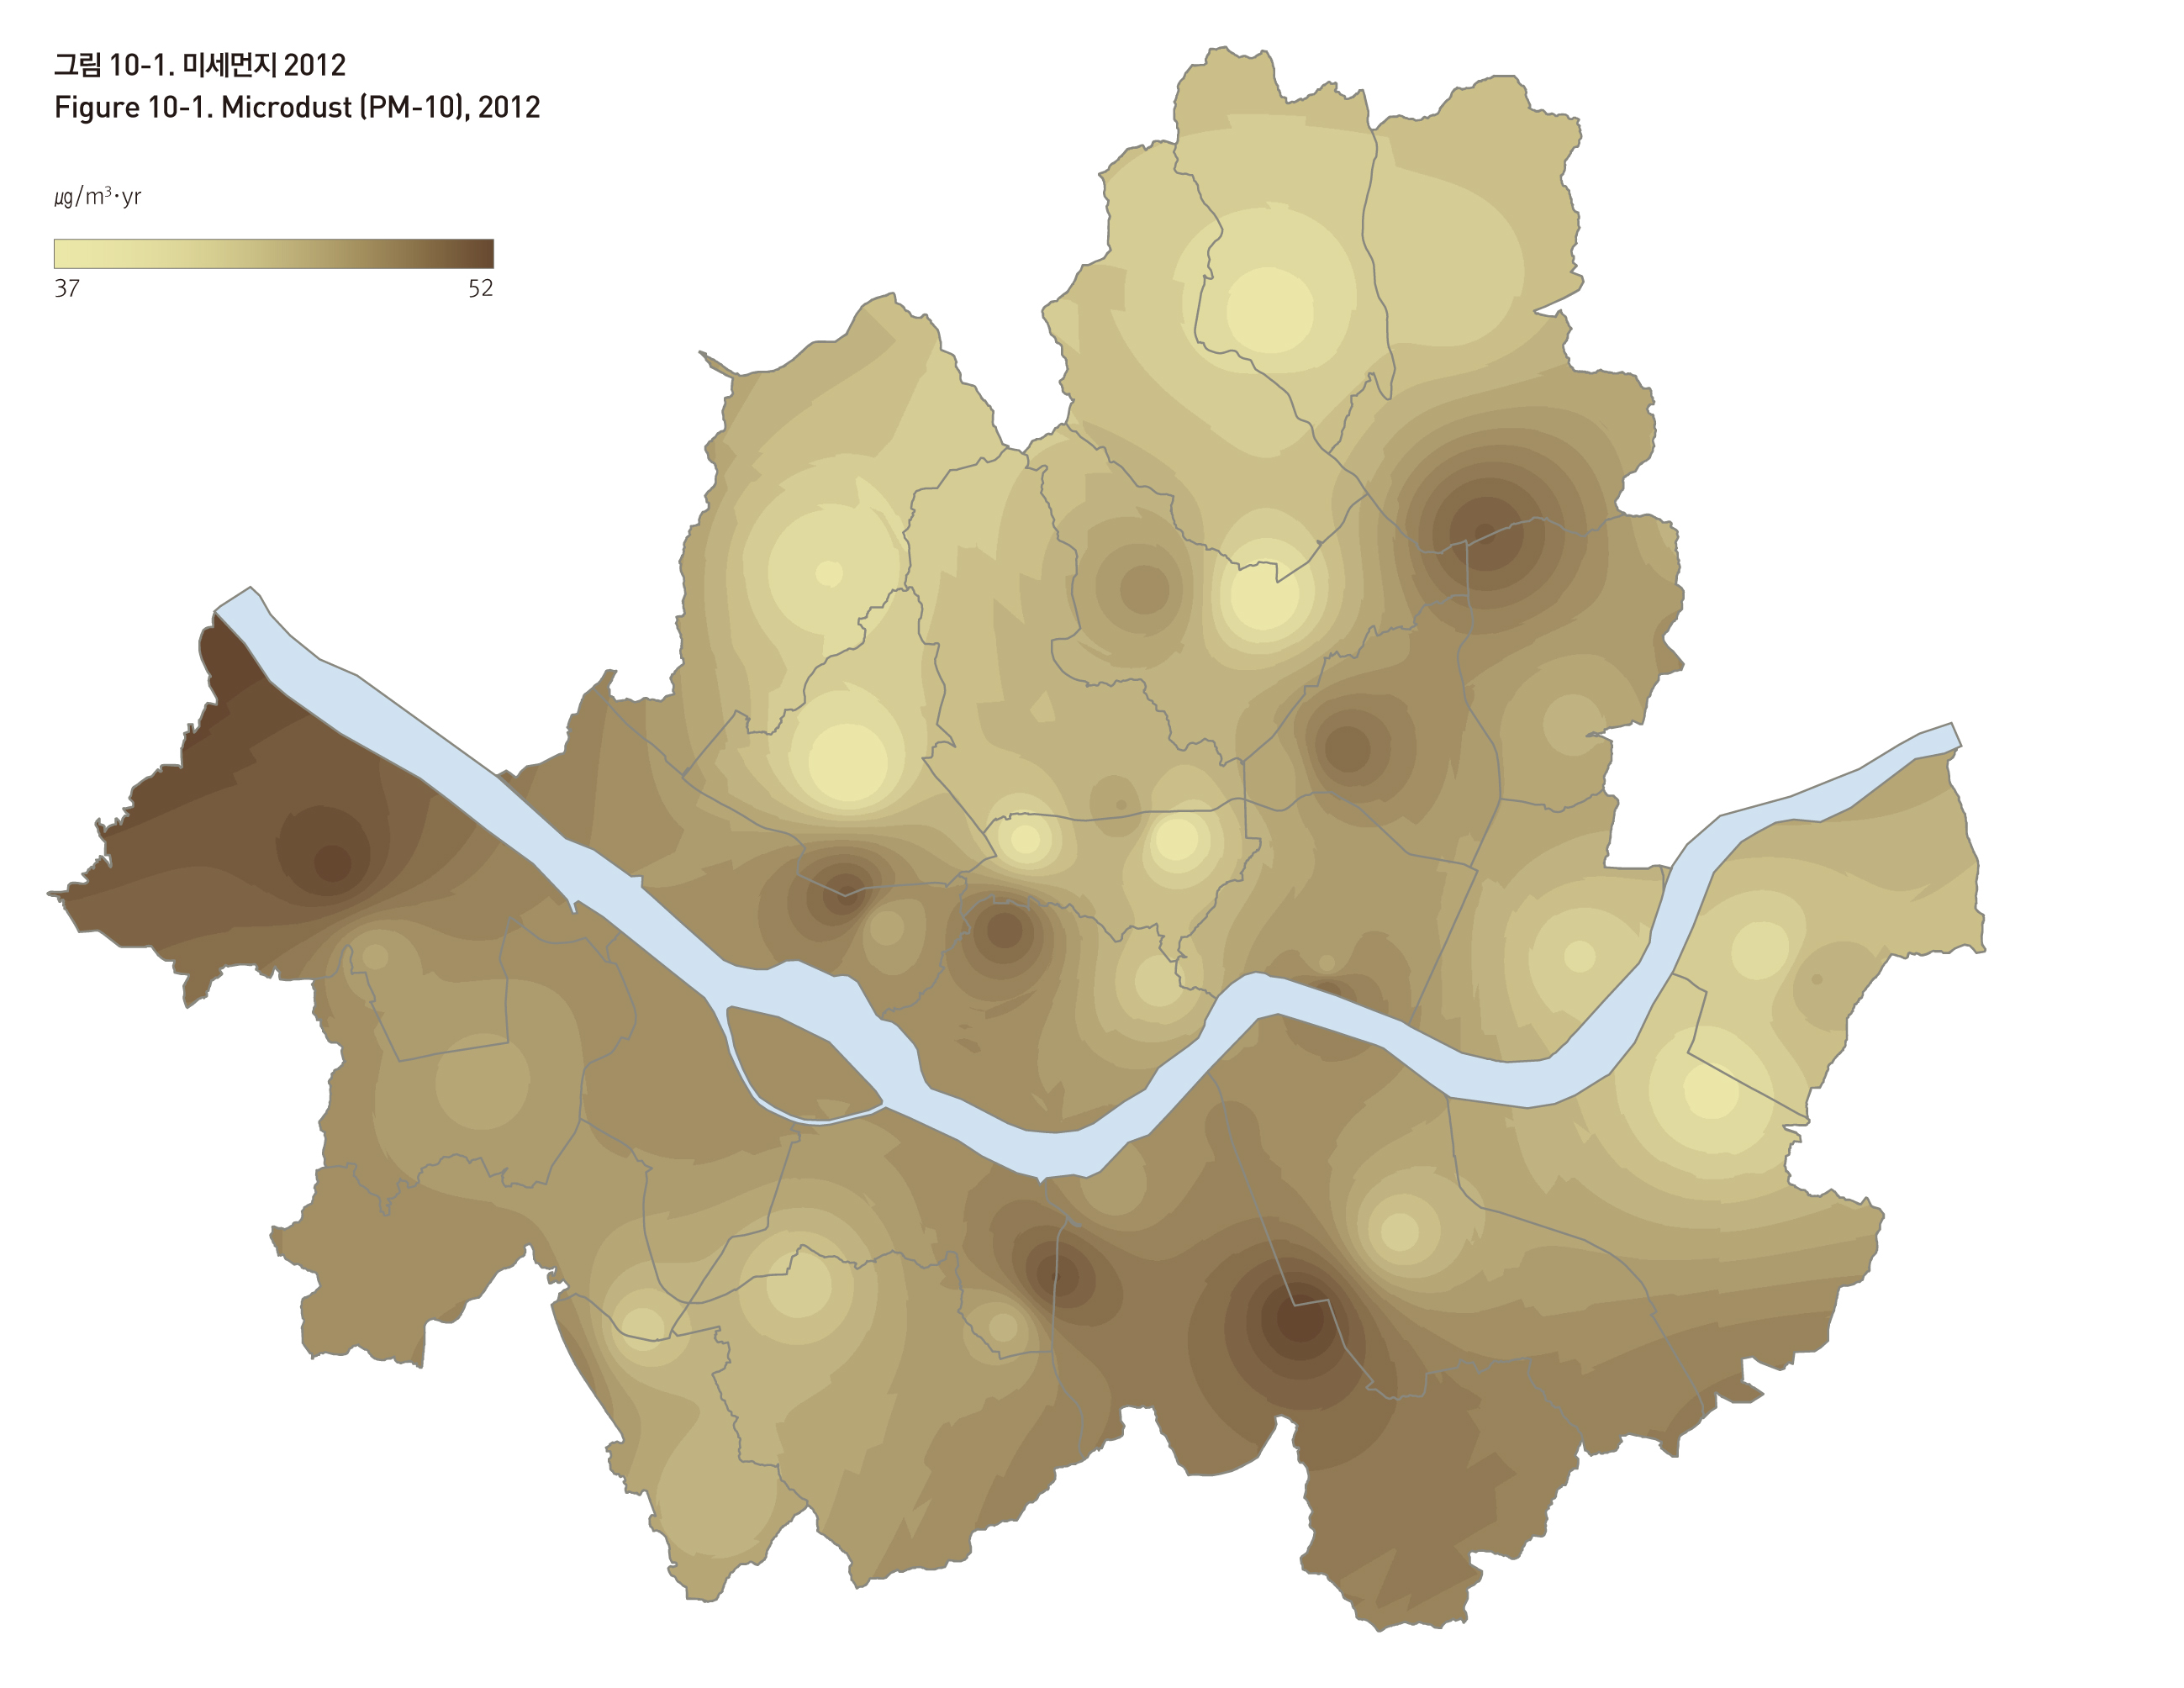
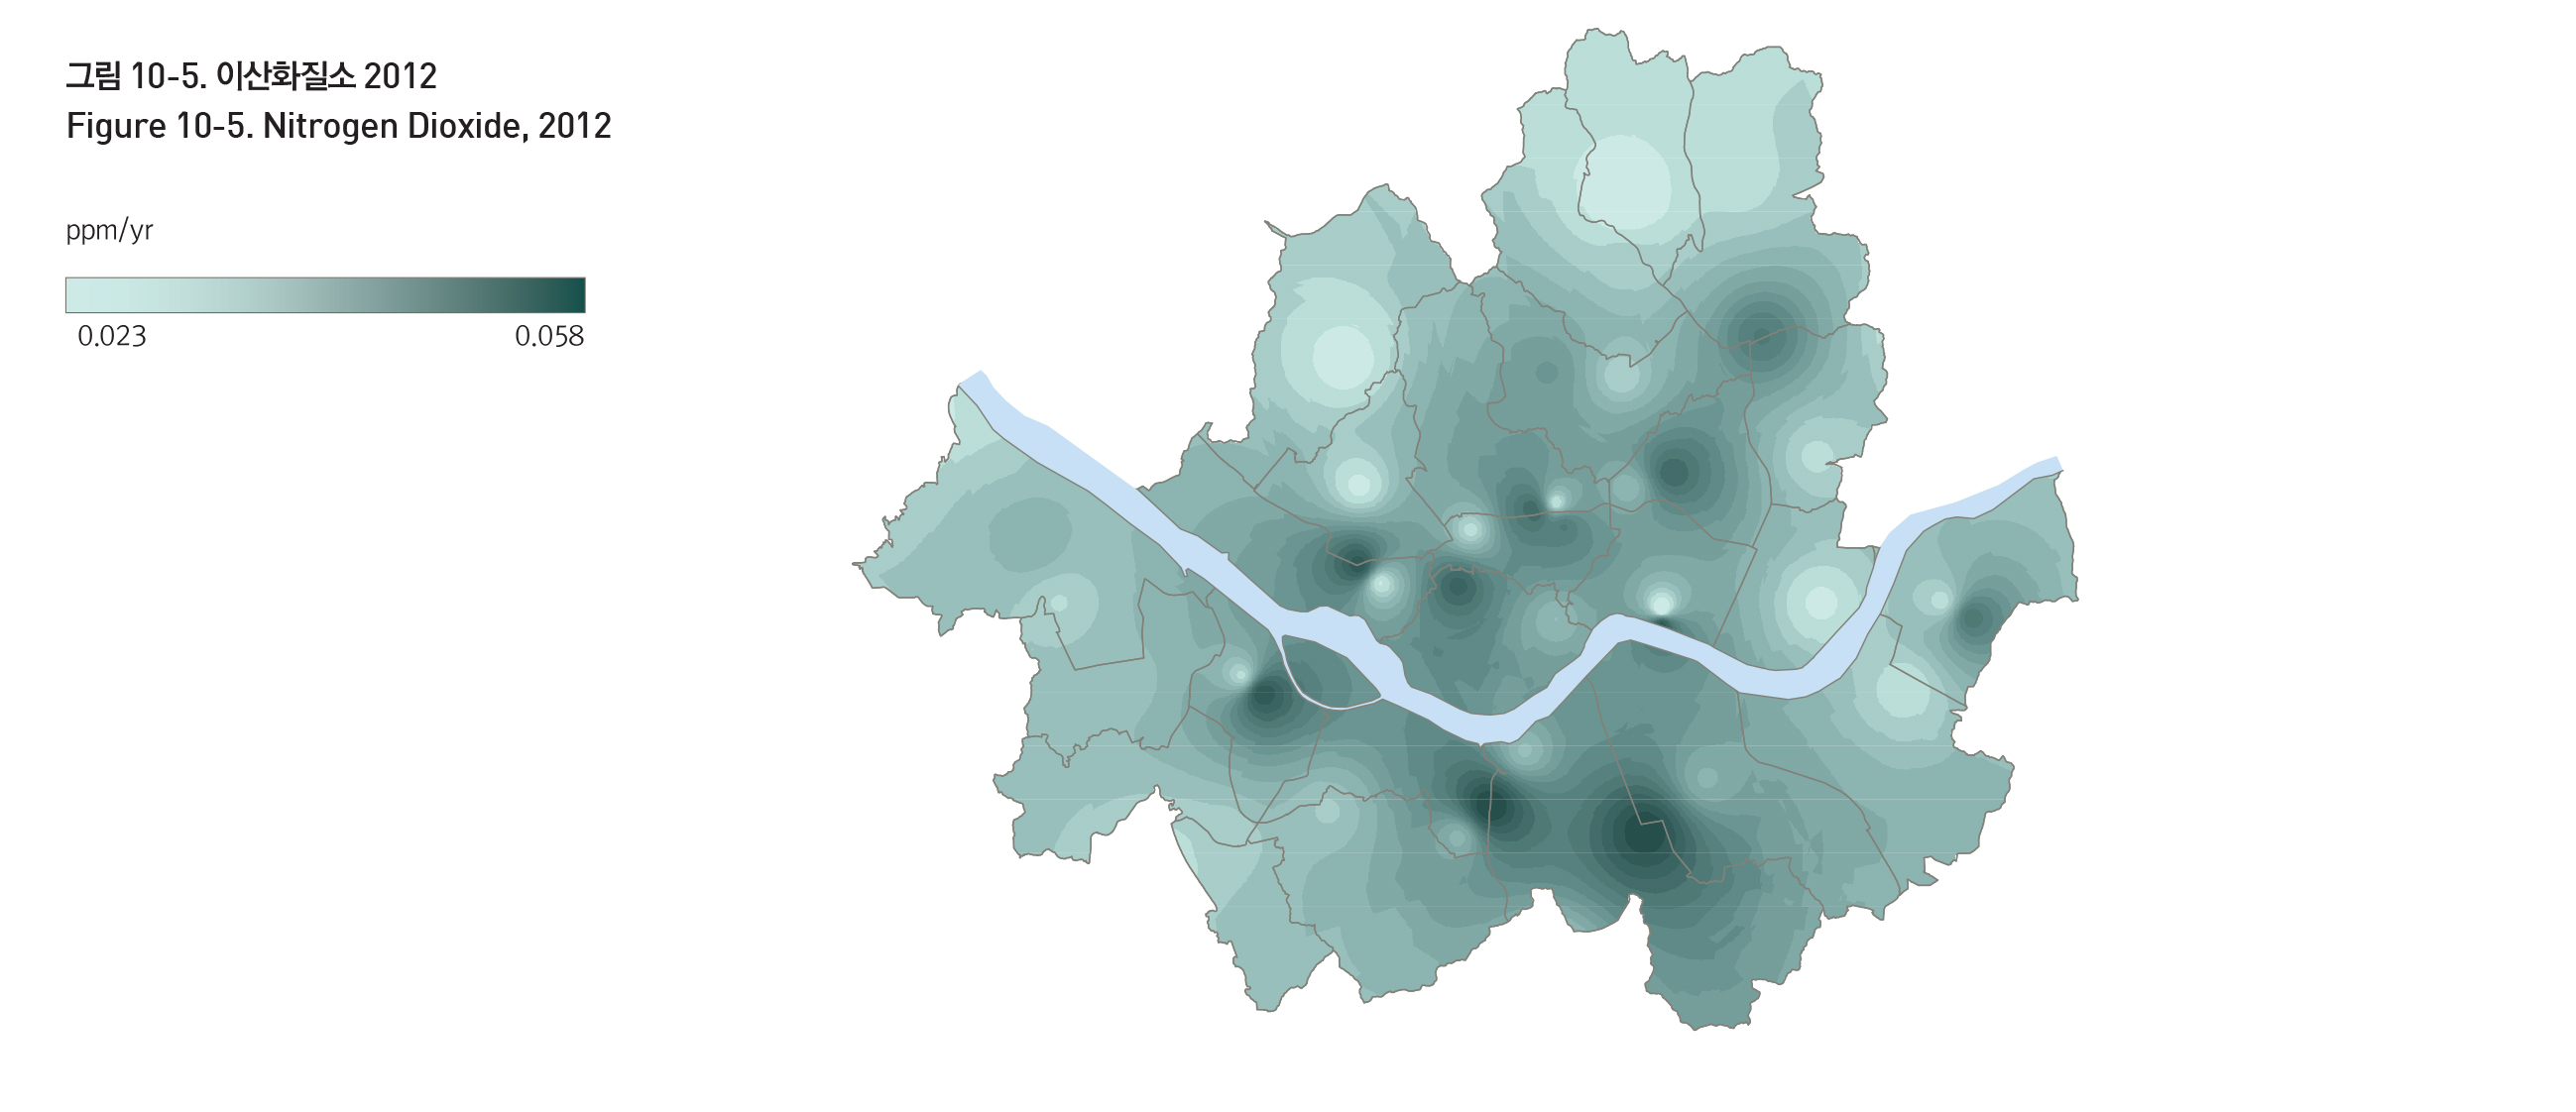
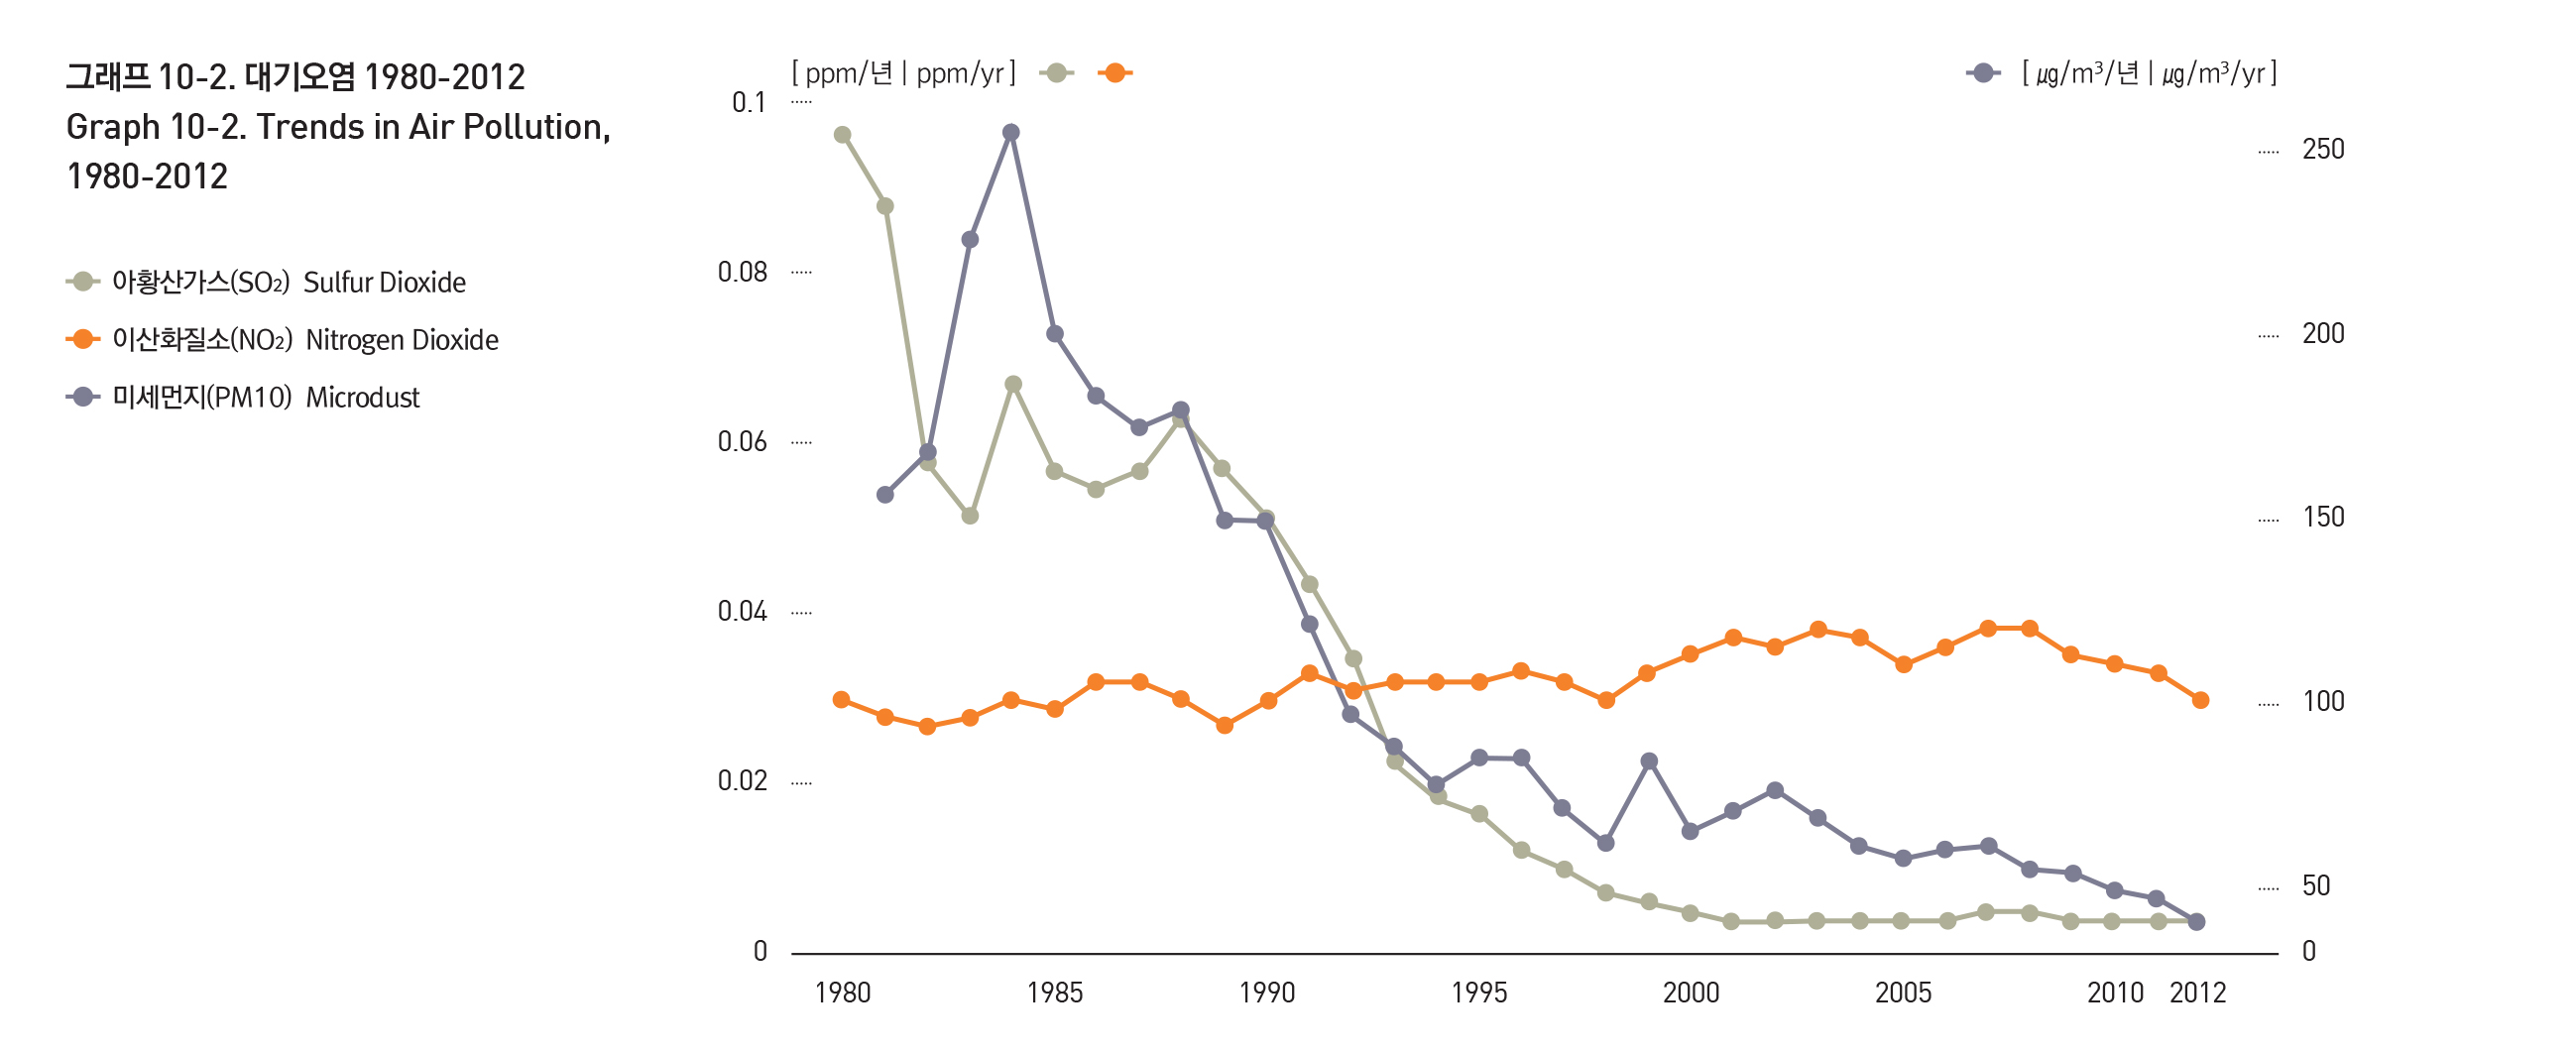
AIR QUALITY
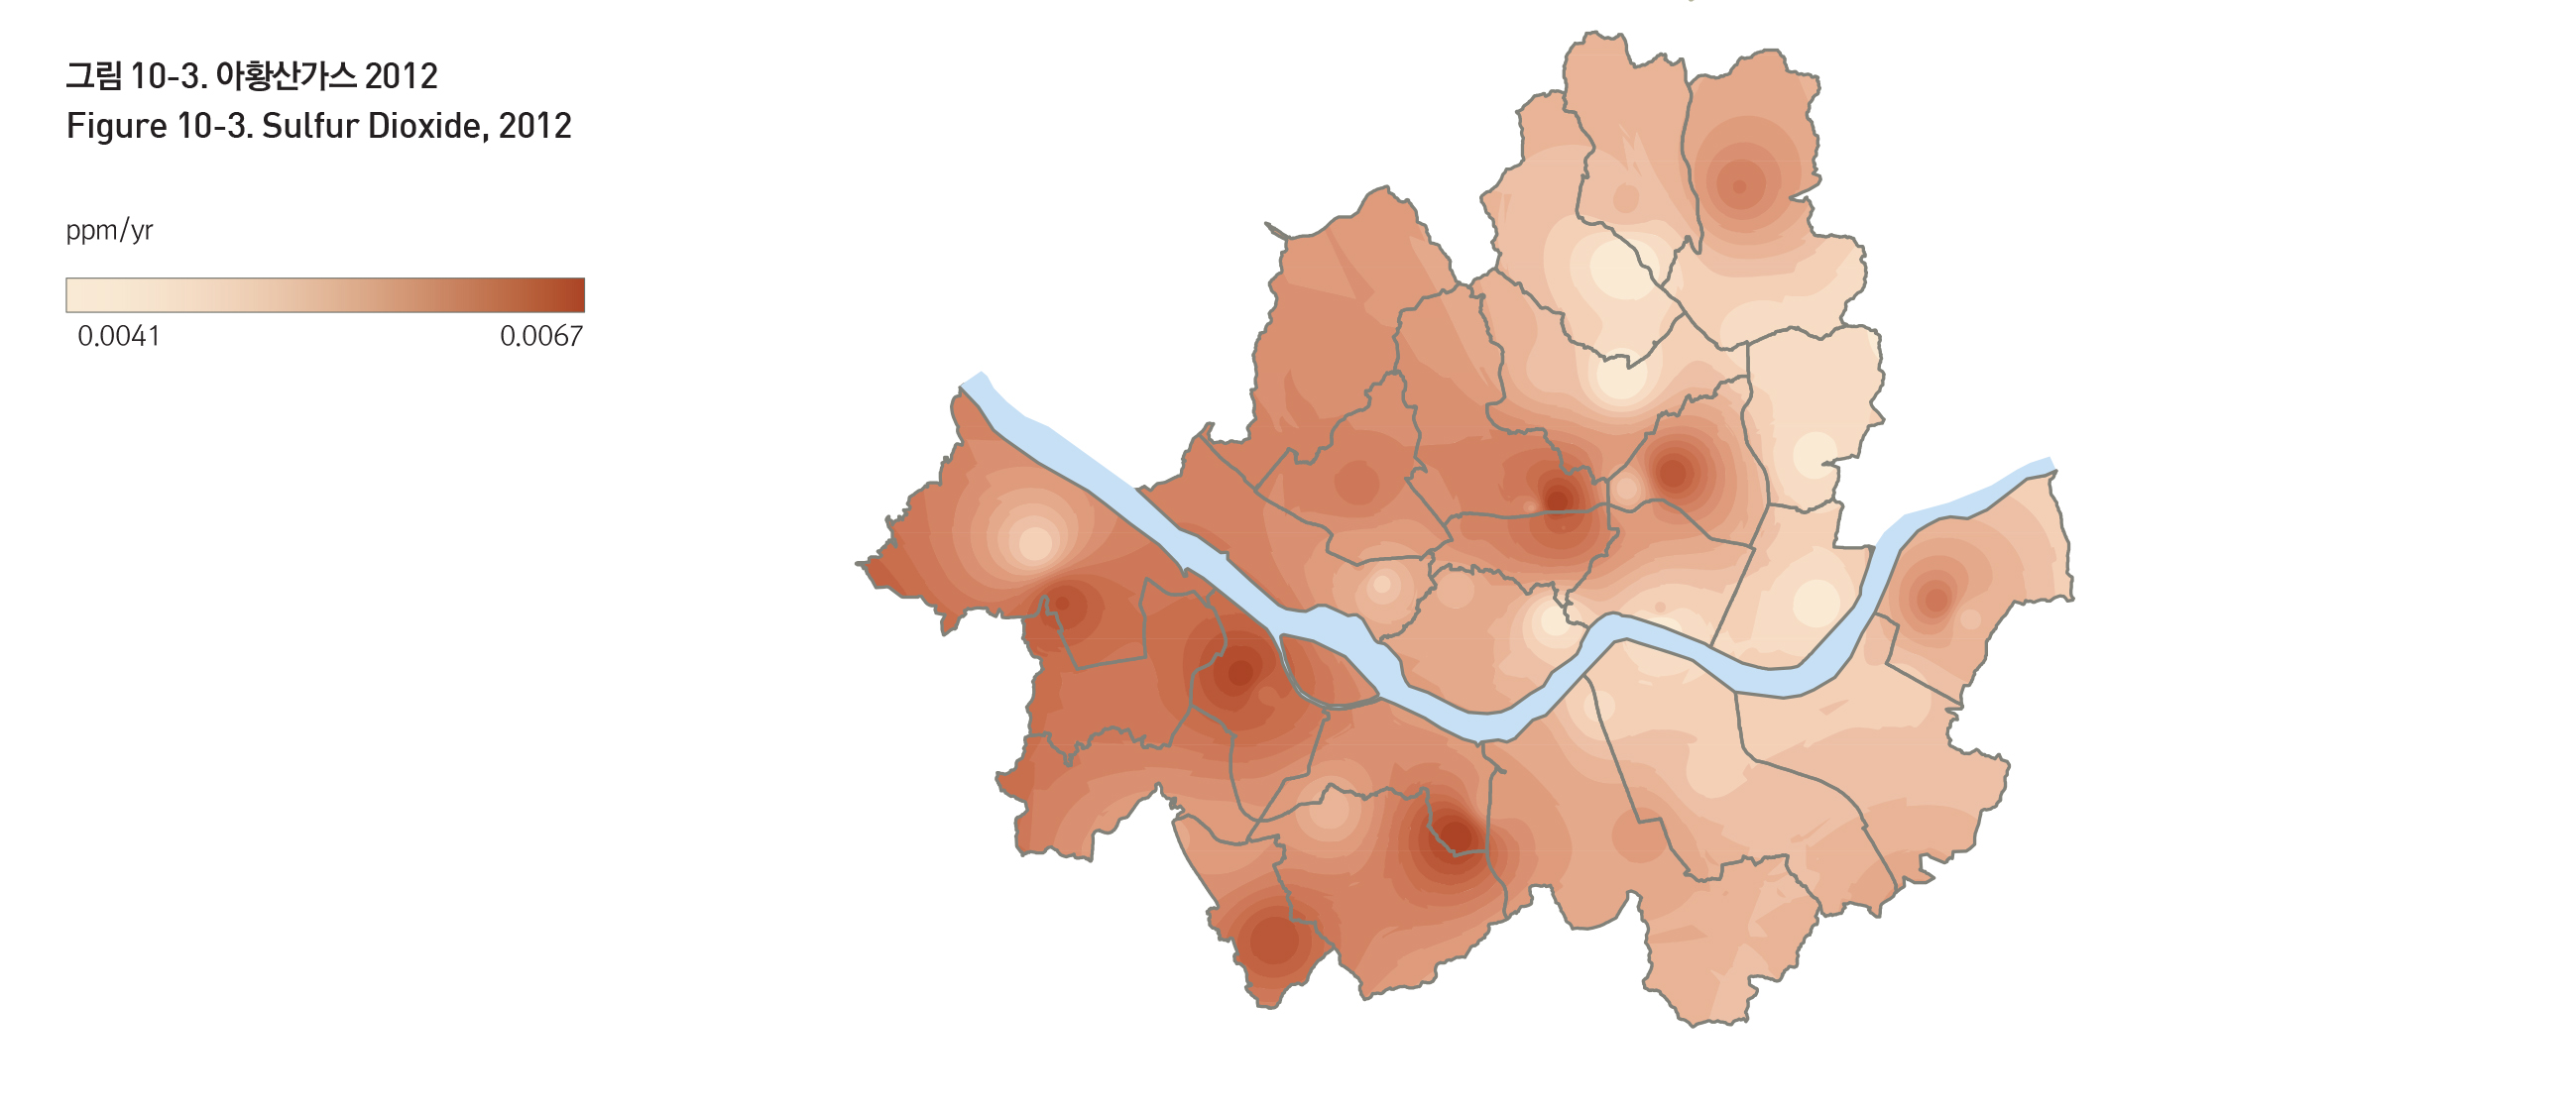
Air pollution became a serious problem in Seoul in the 1980s, due to the hike in the number of licensed automobiles in the 1980s and the rapid population and industrial growth of the 1960-70s. Seoul's air quality began to improve after regulations were placed on sources of air pollution, such as requirements on natural fuel use in 1988. In 1981, the level of PM-10 in Seoul was at 156㎍/㎡, about 2.6 times higher than the regulation standards of 60㎍/㎡. After reaching its peak in 1984 at 254㎍/㎡, PM-10 levels began to decline. As of 2012, PM-10 levels are currently at 41㎍/㎡, safely below the city's annual regulation standards. In 1980, the SO2 levels were at their highest at 0.094ppm, over 9.4 times the regulation standards. They steadily declined thereafter, remaining at 0.005ppm as of 2012.
Source: The Social Maps of Seoul in The Seoul Research Data Service http://data.si.re.kr/map-seoul-2013
Origin : Ministry of Environment 국립환경과학원, 대기오염측정자료, 2012년
Source: The Social Maps of Seoul in The Seoul Research Data Service http://data.si.re.kr/map-seoul-2013
Origin : Ministry of Environment 국립환경과학원, 대기오염측정자료, 2012년
Source: The Social Maps of Seoul in The Seoul Research Data Service http://data.si.re.kr/map-seoul-2013
Origin : Ministry of Environment 국립환경과학원, 대기오염측정자료, 2012년
Source: The Social Maps of Seoul in The Seoul Research Data Service http://data.si.re.kr/map-seoul-2013
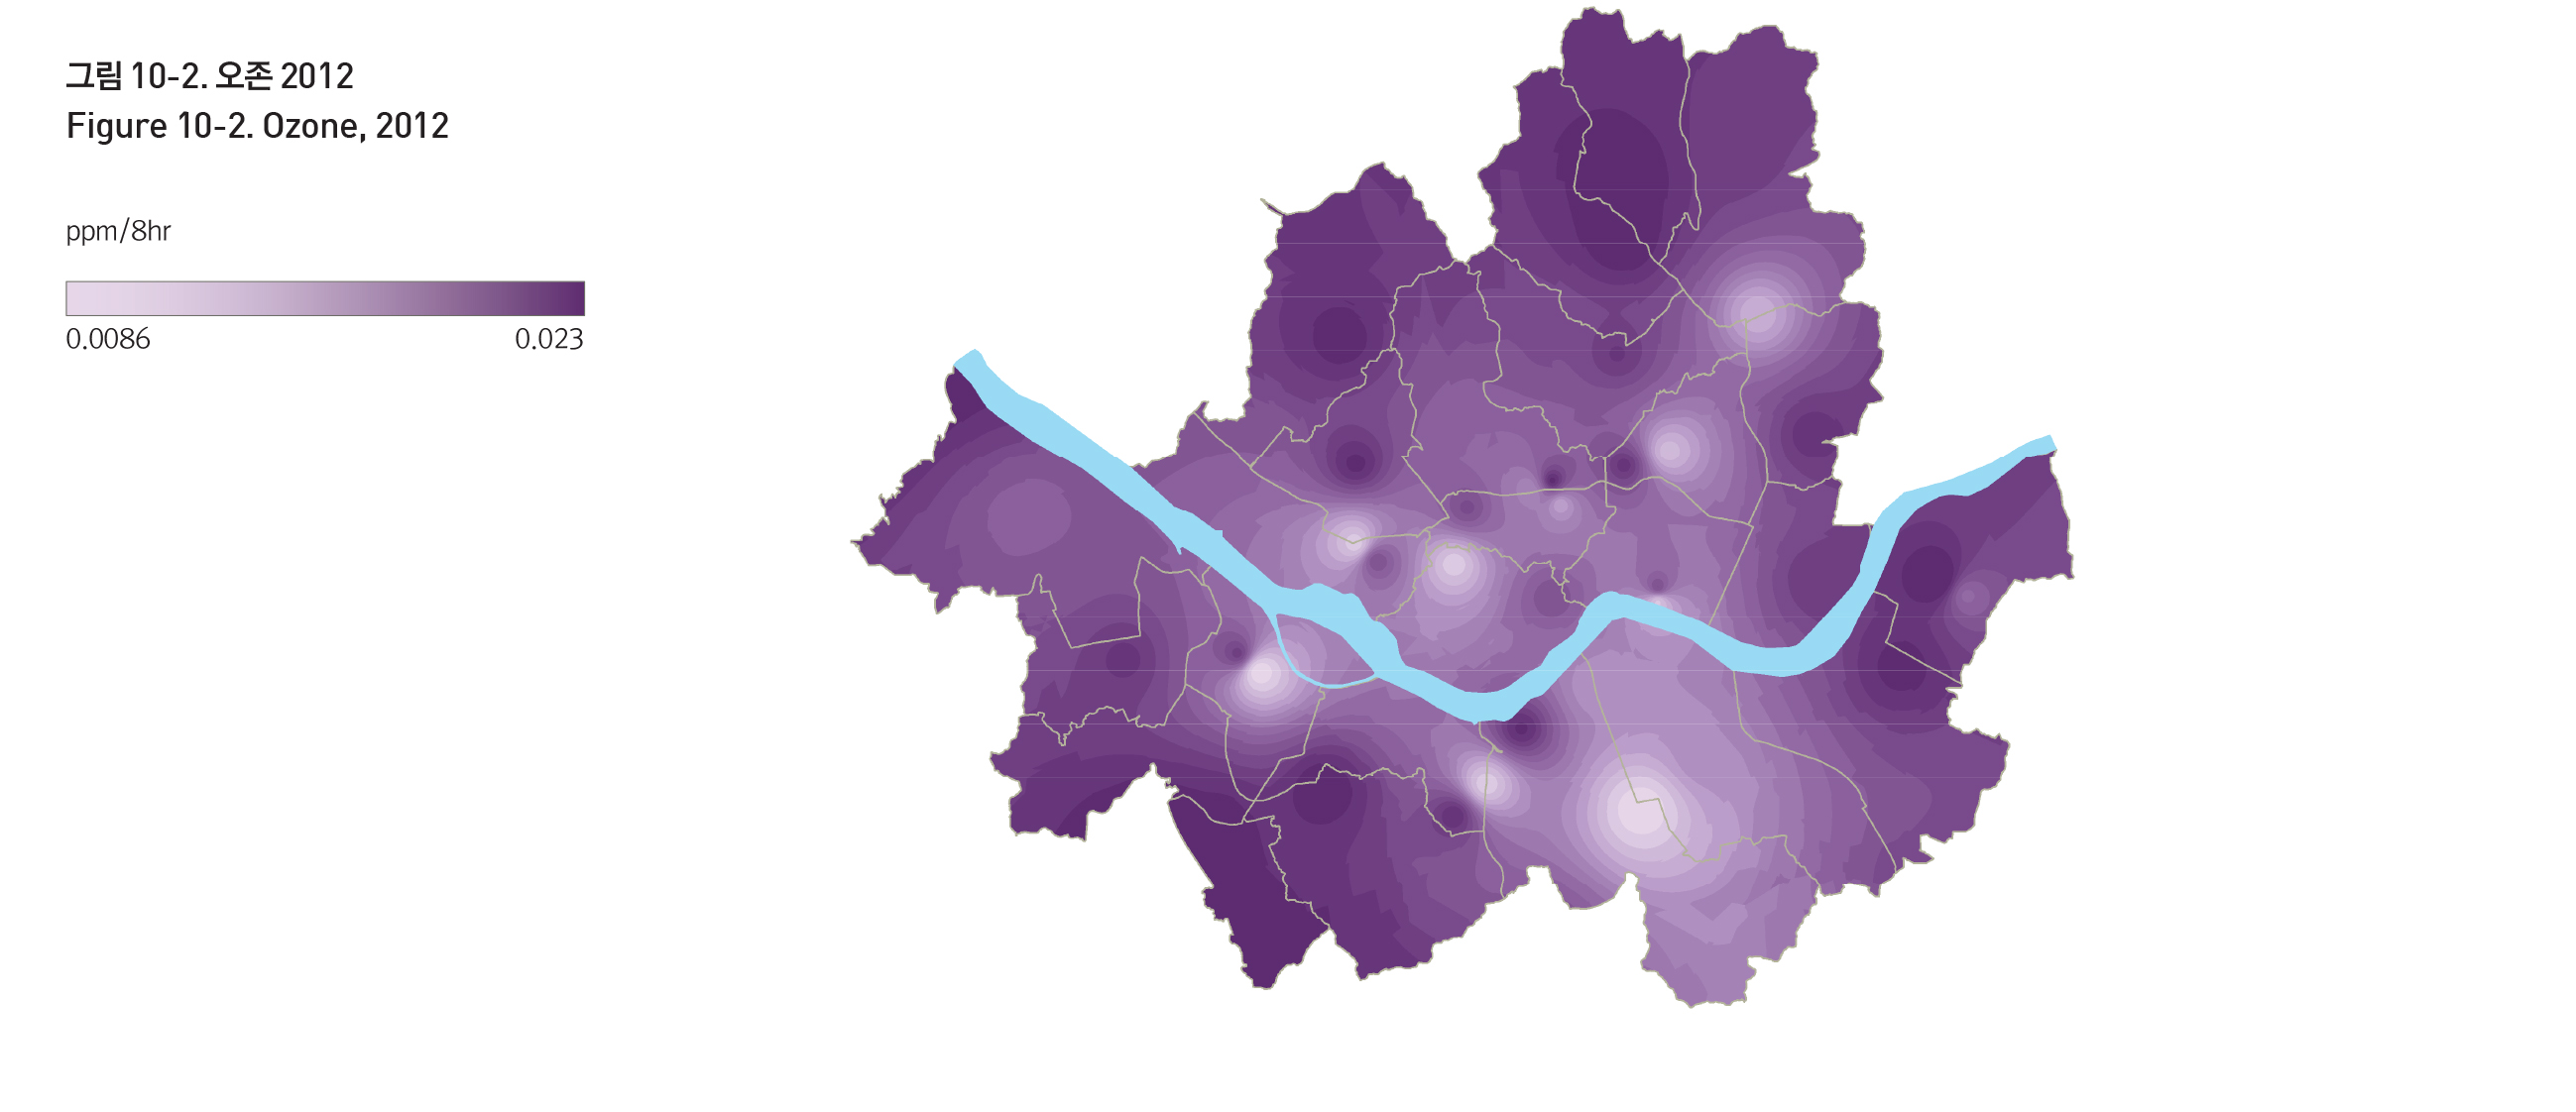
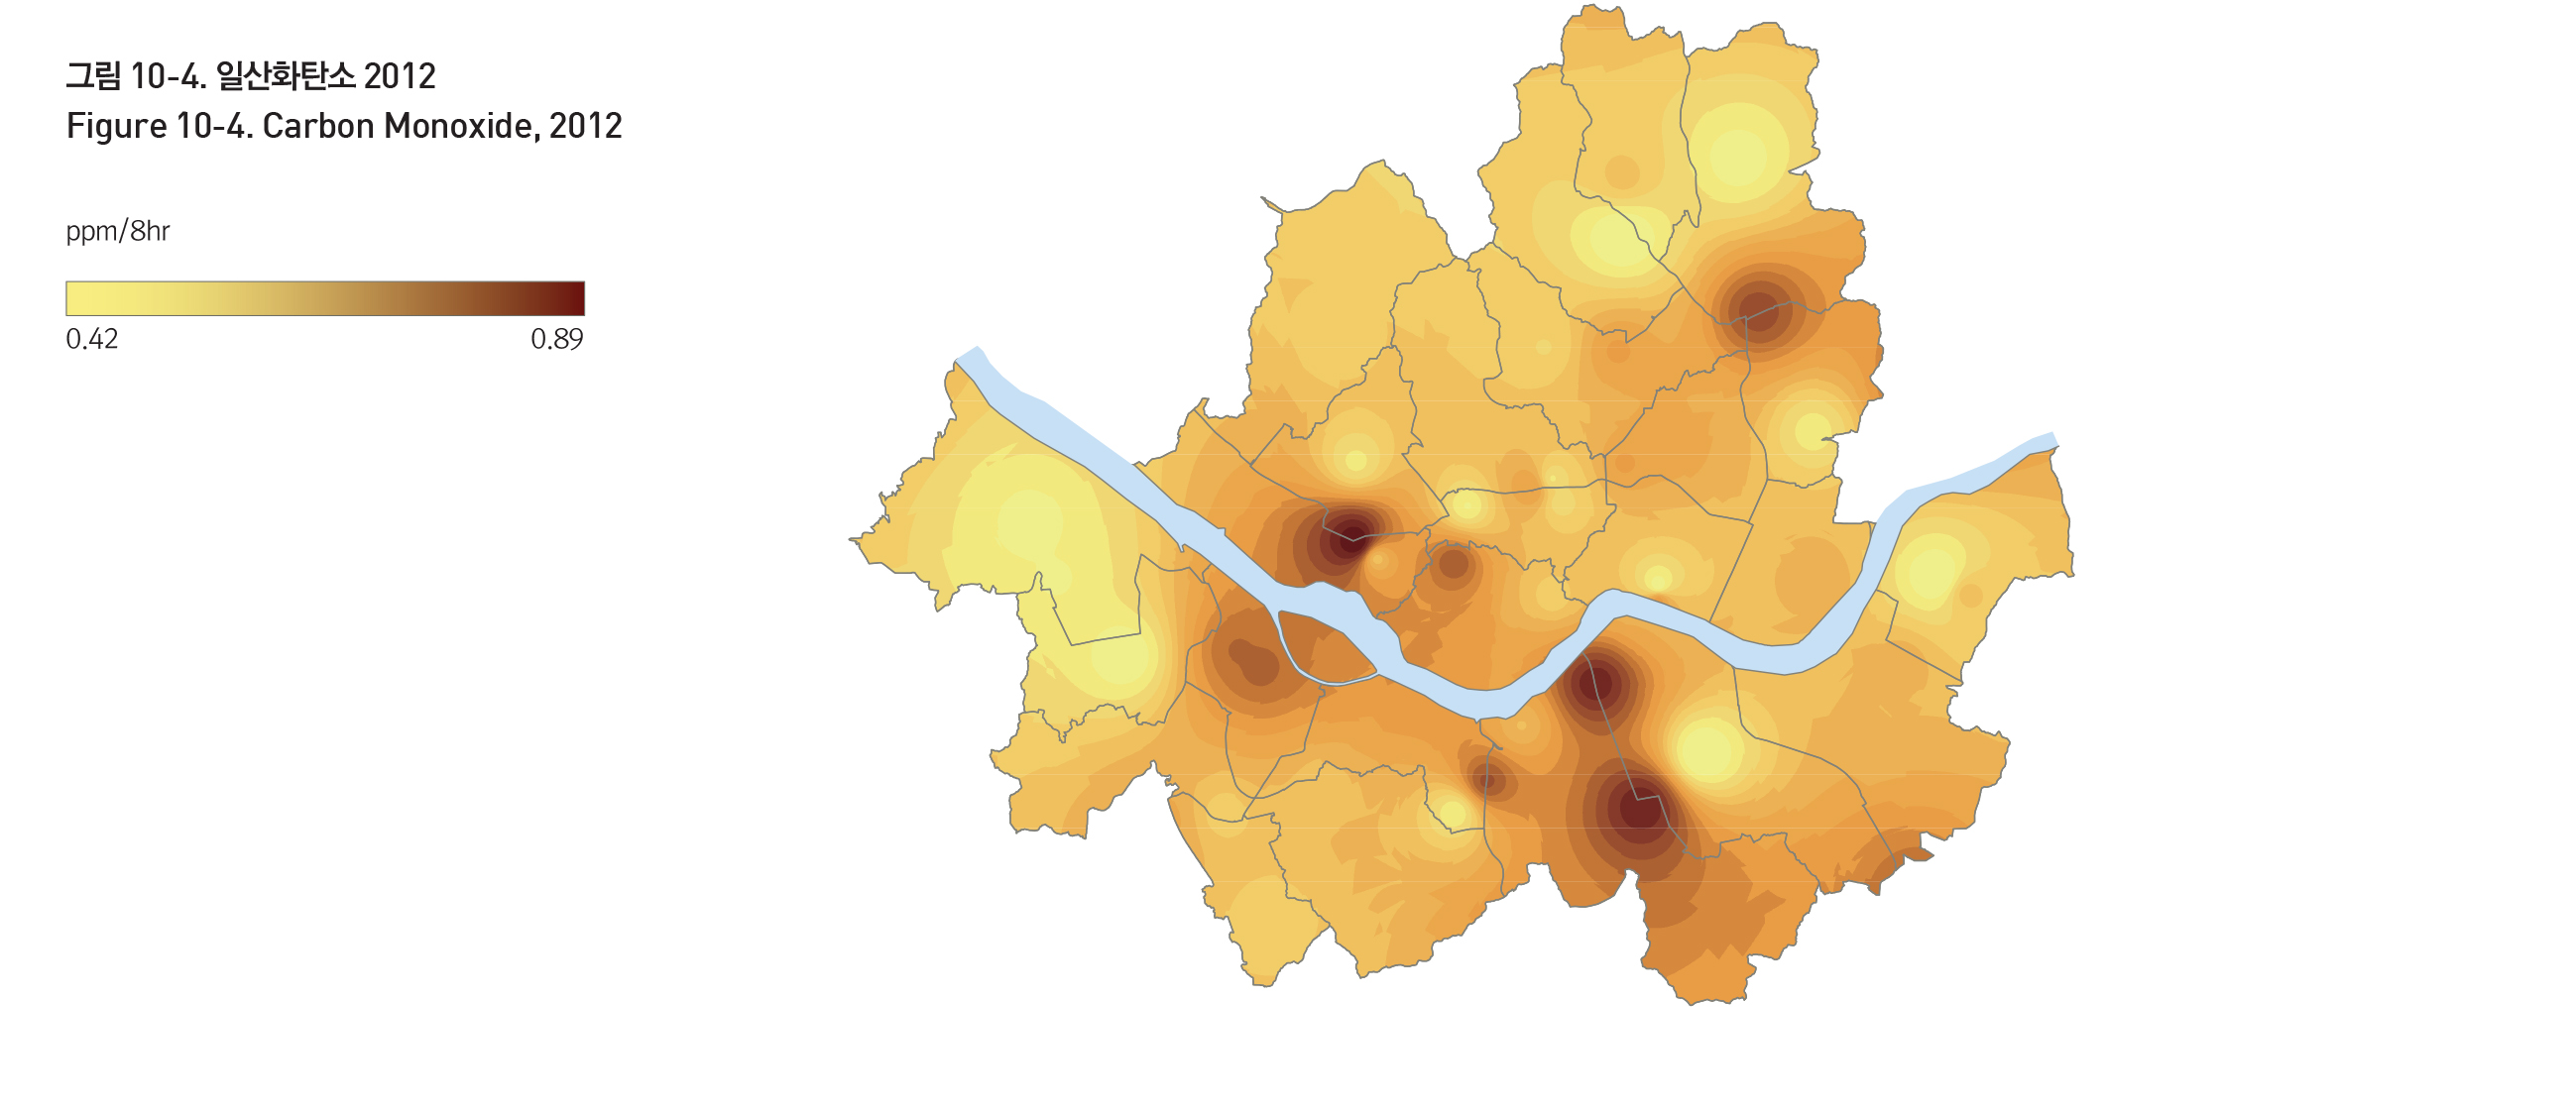
The current level of carbon monoxide in Seoul is 0.5ppm/8hr, well under the city regulation standards of 9ppm/8hr. Prior to 2006, when the city regulation standards for nitrogen dioxide were 0.04ppm, nitrogen dioxide were also well under these levels.
When the standards were raised to 0.03ppm in 2006, the nitrogen dioxide concentration in Seoul remained above these standards, before scaling down at 0.03ppm as of 2012.
These figures show that while the concentration of PM-10 and SO2 is gradually decreasing, the level of nitrogen dioxide has not improved significantly. Seoul aims to reduce these pollutants and improve air quality by regulating their major causes.
Source: The Social Maps of Seoul in The Seoul Research Data Service http://data.si.re.kr/map-seoul-2013
Origin : Ministry of Environment 국립환경과학원, 대기오염측정자료, 2012년
Source: The Social Maps of Seoul in The Seoul Research Data Service http://data.si.re.kr/map-seoul-2013
Origin : Ministry of Environment 국립환경과학원, 대기오염측정자료, 2012년
Source: The Social Maps of Seoul in The Seoul Research Data Service http://data.si.re.kr/map-seoul-2013

Origin : Ministry of Environment 국립환경과학원, 대기오염측정자료, 2012년
Source: The Social Maps of Seoul in The Seoul Research Data Service http://data.si.re.kr/map-seoul-2013
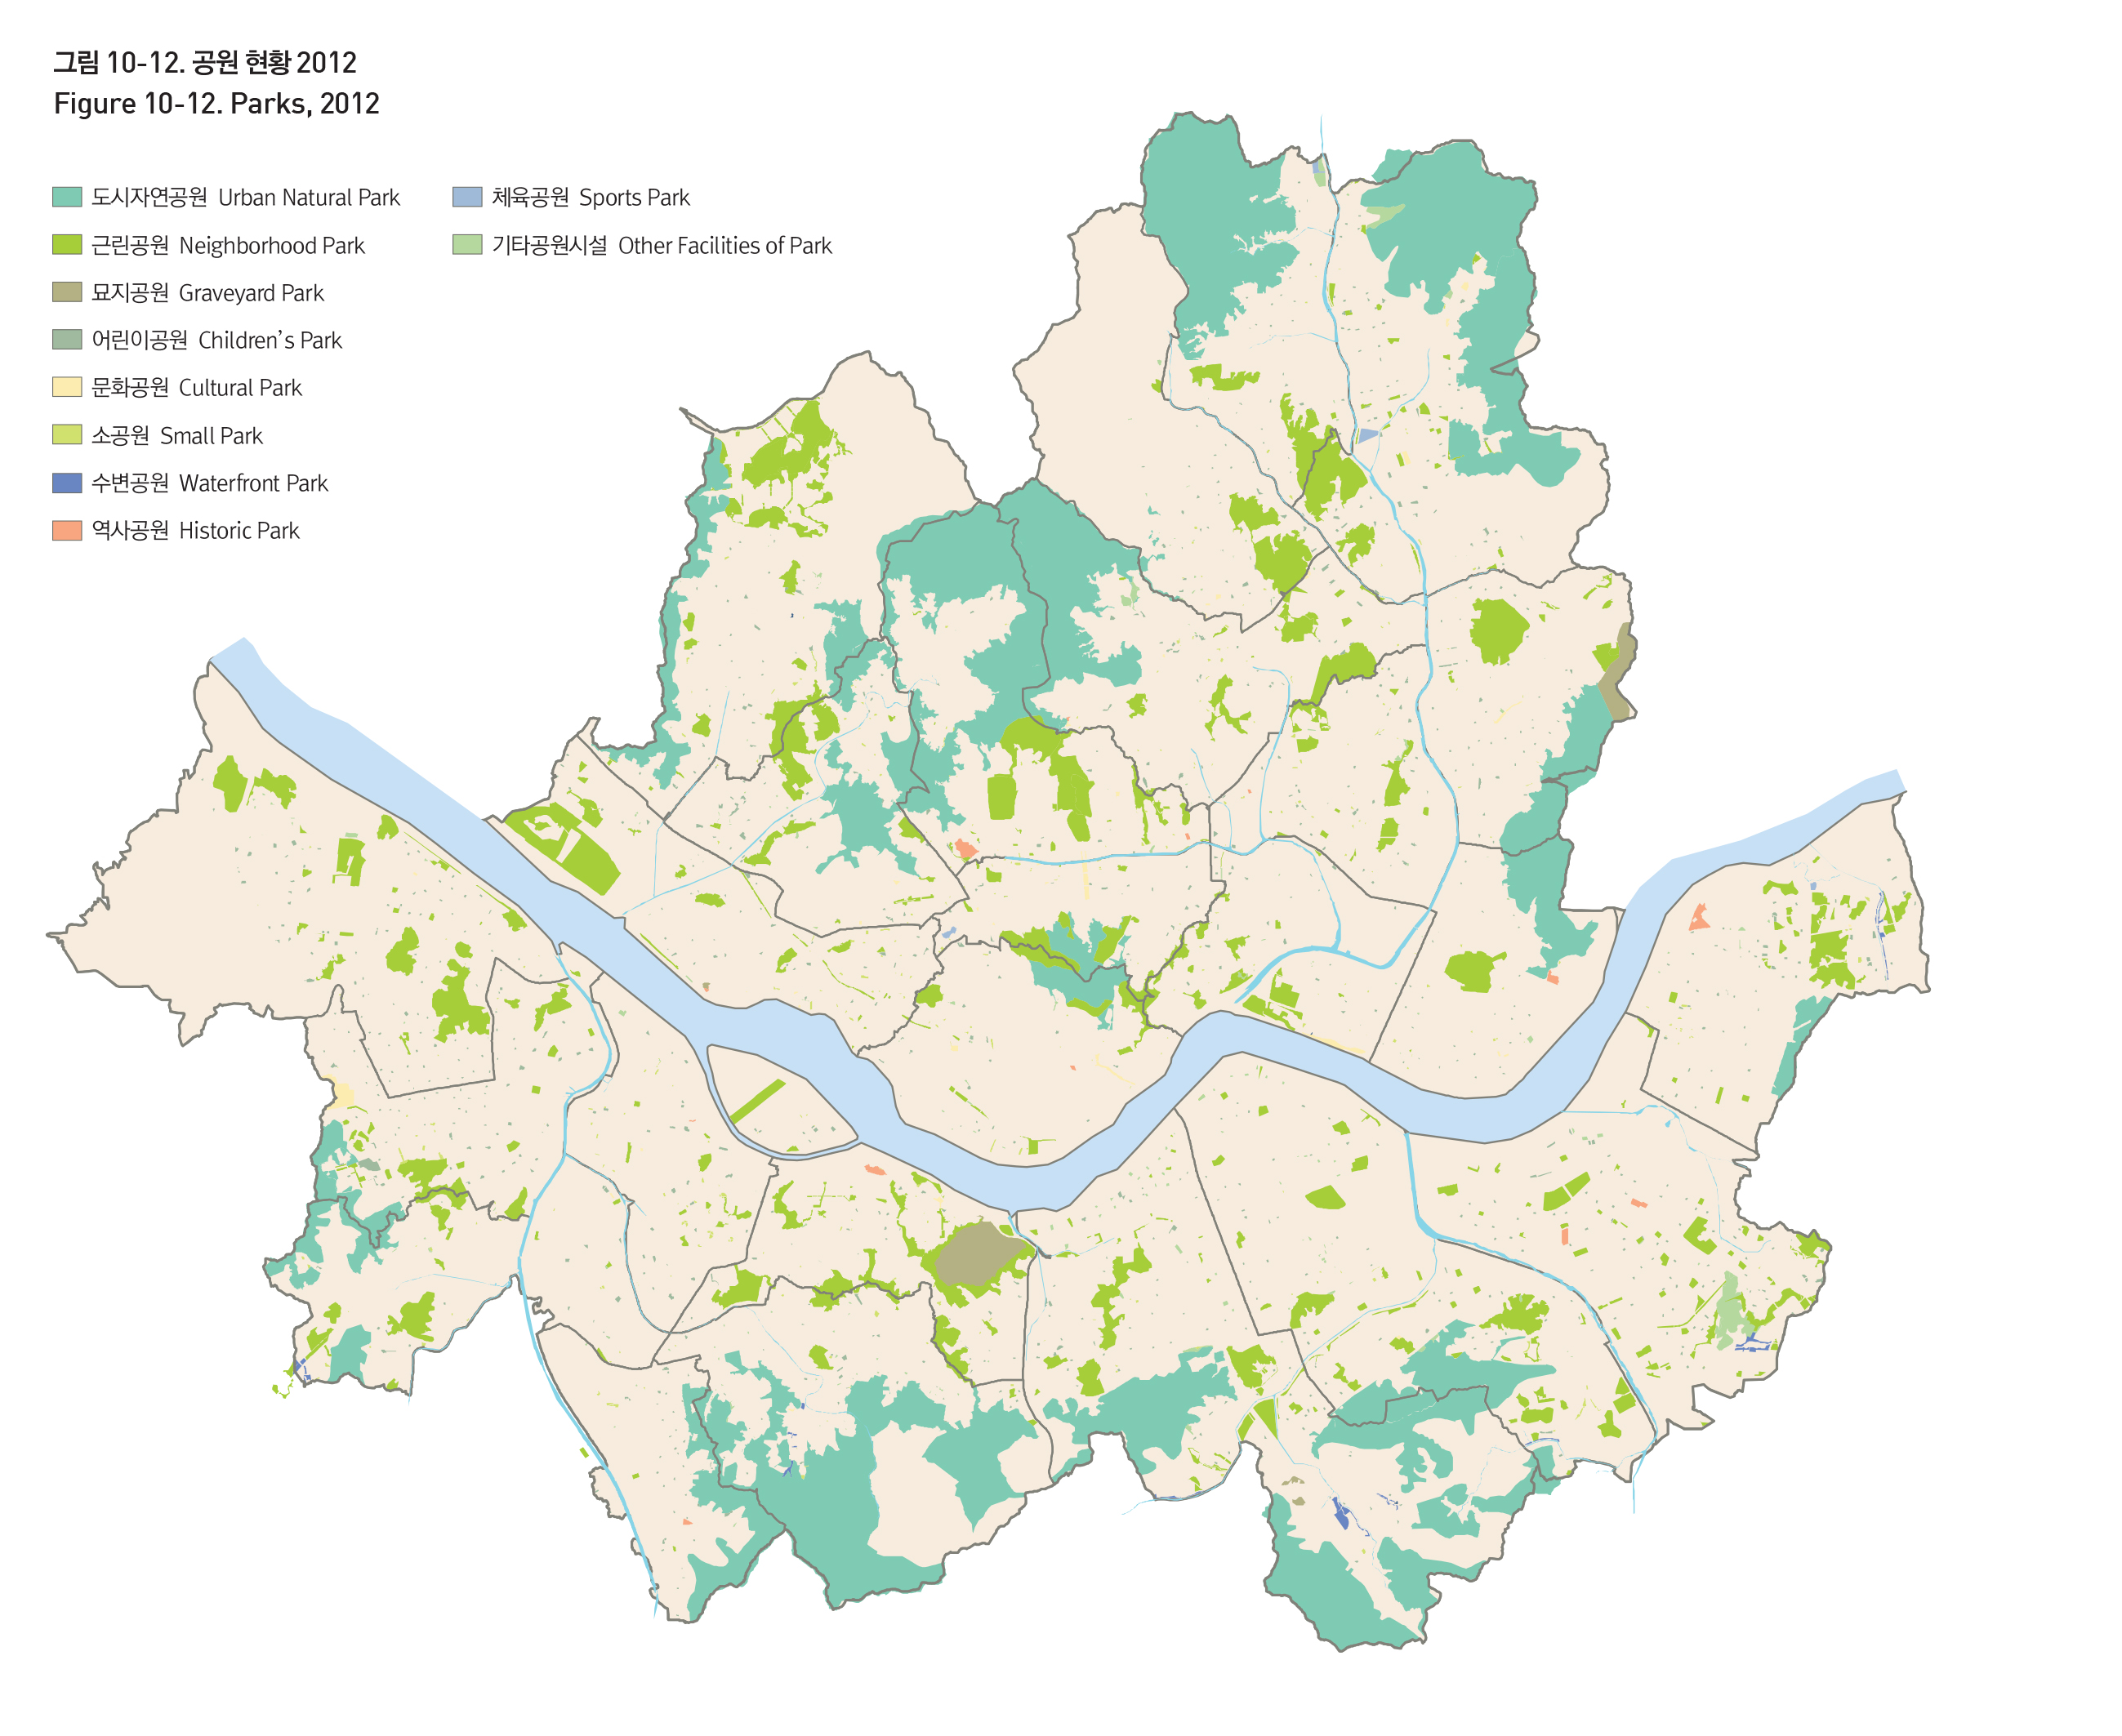
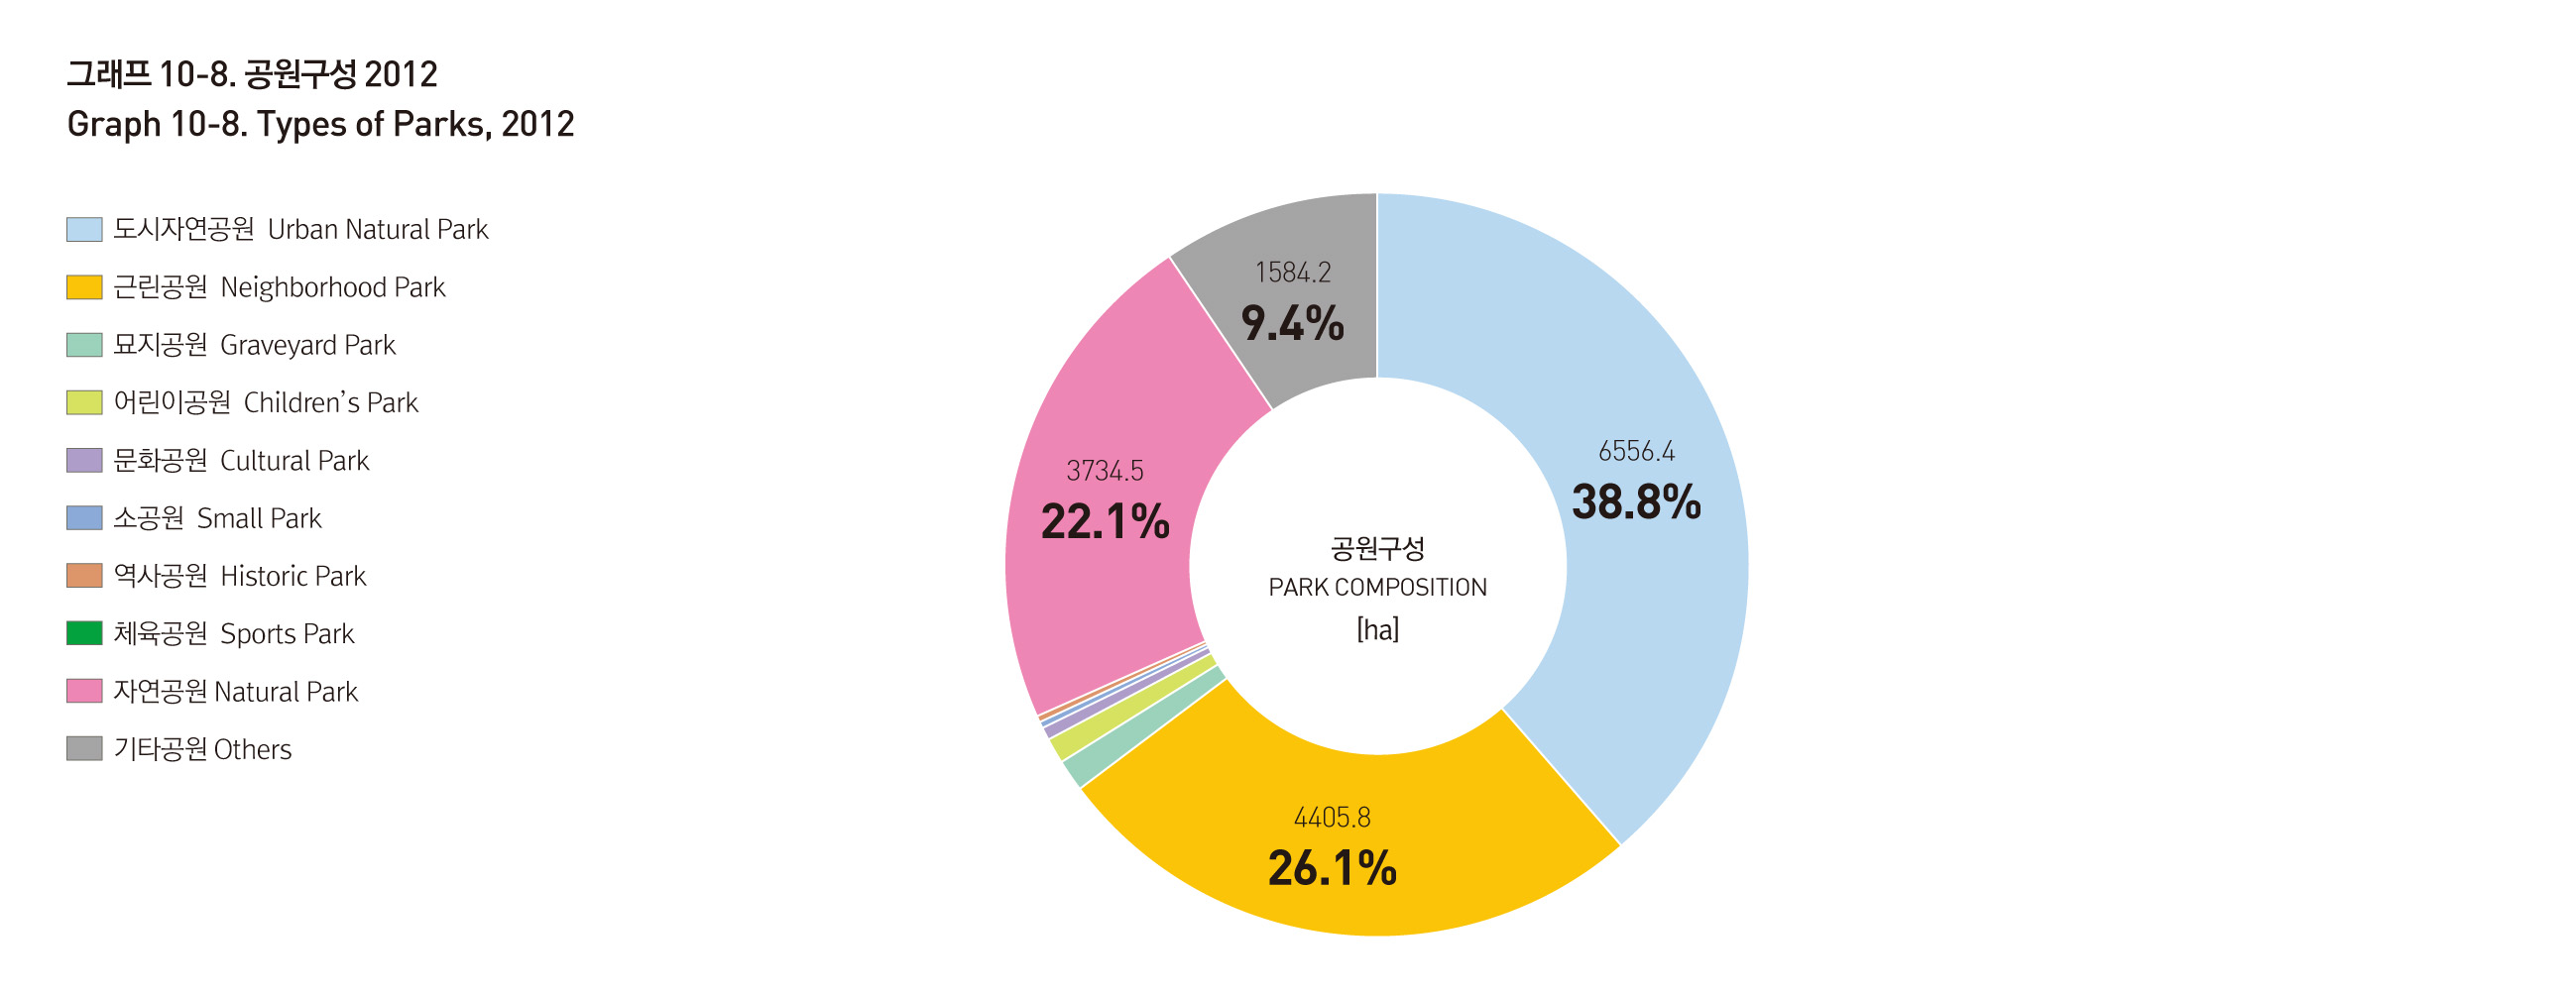
PARKS
As of 2012, the total surface area of public parks within Seoul's administrative area is about 170㎢, amounting to about 16.2㎡ per resident. The number of parks in Seoul increased dramatically from 393 to 2,045 in the years between 1974 and 1983.
Today, there are a total of 2,643 parks in Seoul. Park area per person generally decreased, because the growth in population greatly outmatched the growth in park area. The recent years been seen exceptions to this general trend, due to the city's population decline. Urban natural parks are the most common type of parks in Seoul, making up 38.56% followed by neighborhood parks at 25.45%, natural parks at 23.20% and other types of parks at 9.31%.
Origin : Seoul Metropolitan Government, 도시계획정보관리시스템(UPIS), 도시계획시설, 2012년
Source: The Social Maps of Seoul in The Seoul Research Data Service http://data.si.re.kr/map-seoul-2013

Origin : Seoul Metropolitan Government, Seoul Statistics
Source: The Social Maps of Seoul in The Seoul Research Data Service http://data.si.re.kr/map-seoul-2013
Origin : Seoul Metropolitan Government, 도시계획정보관리시스템(UPIS), 도시계획시설, 2012년
Source: The Social Maps of Seoul in The Seoul Research Data Service http://data.si.re.kr/map-seoul-2013
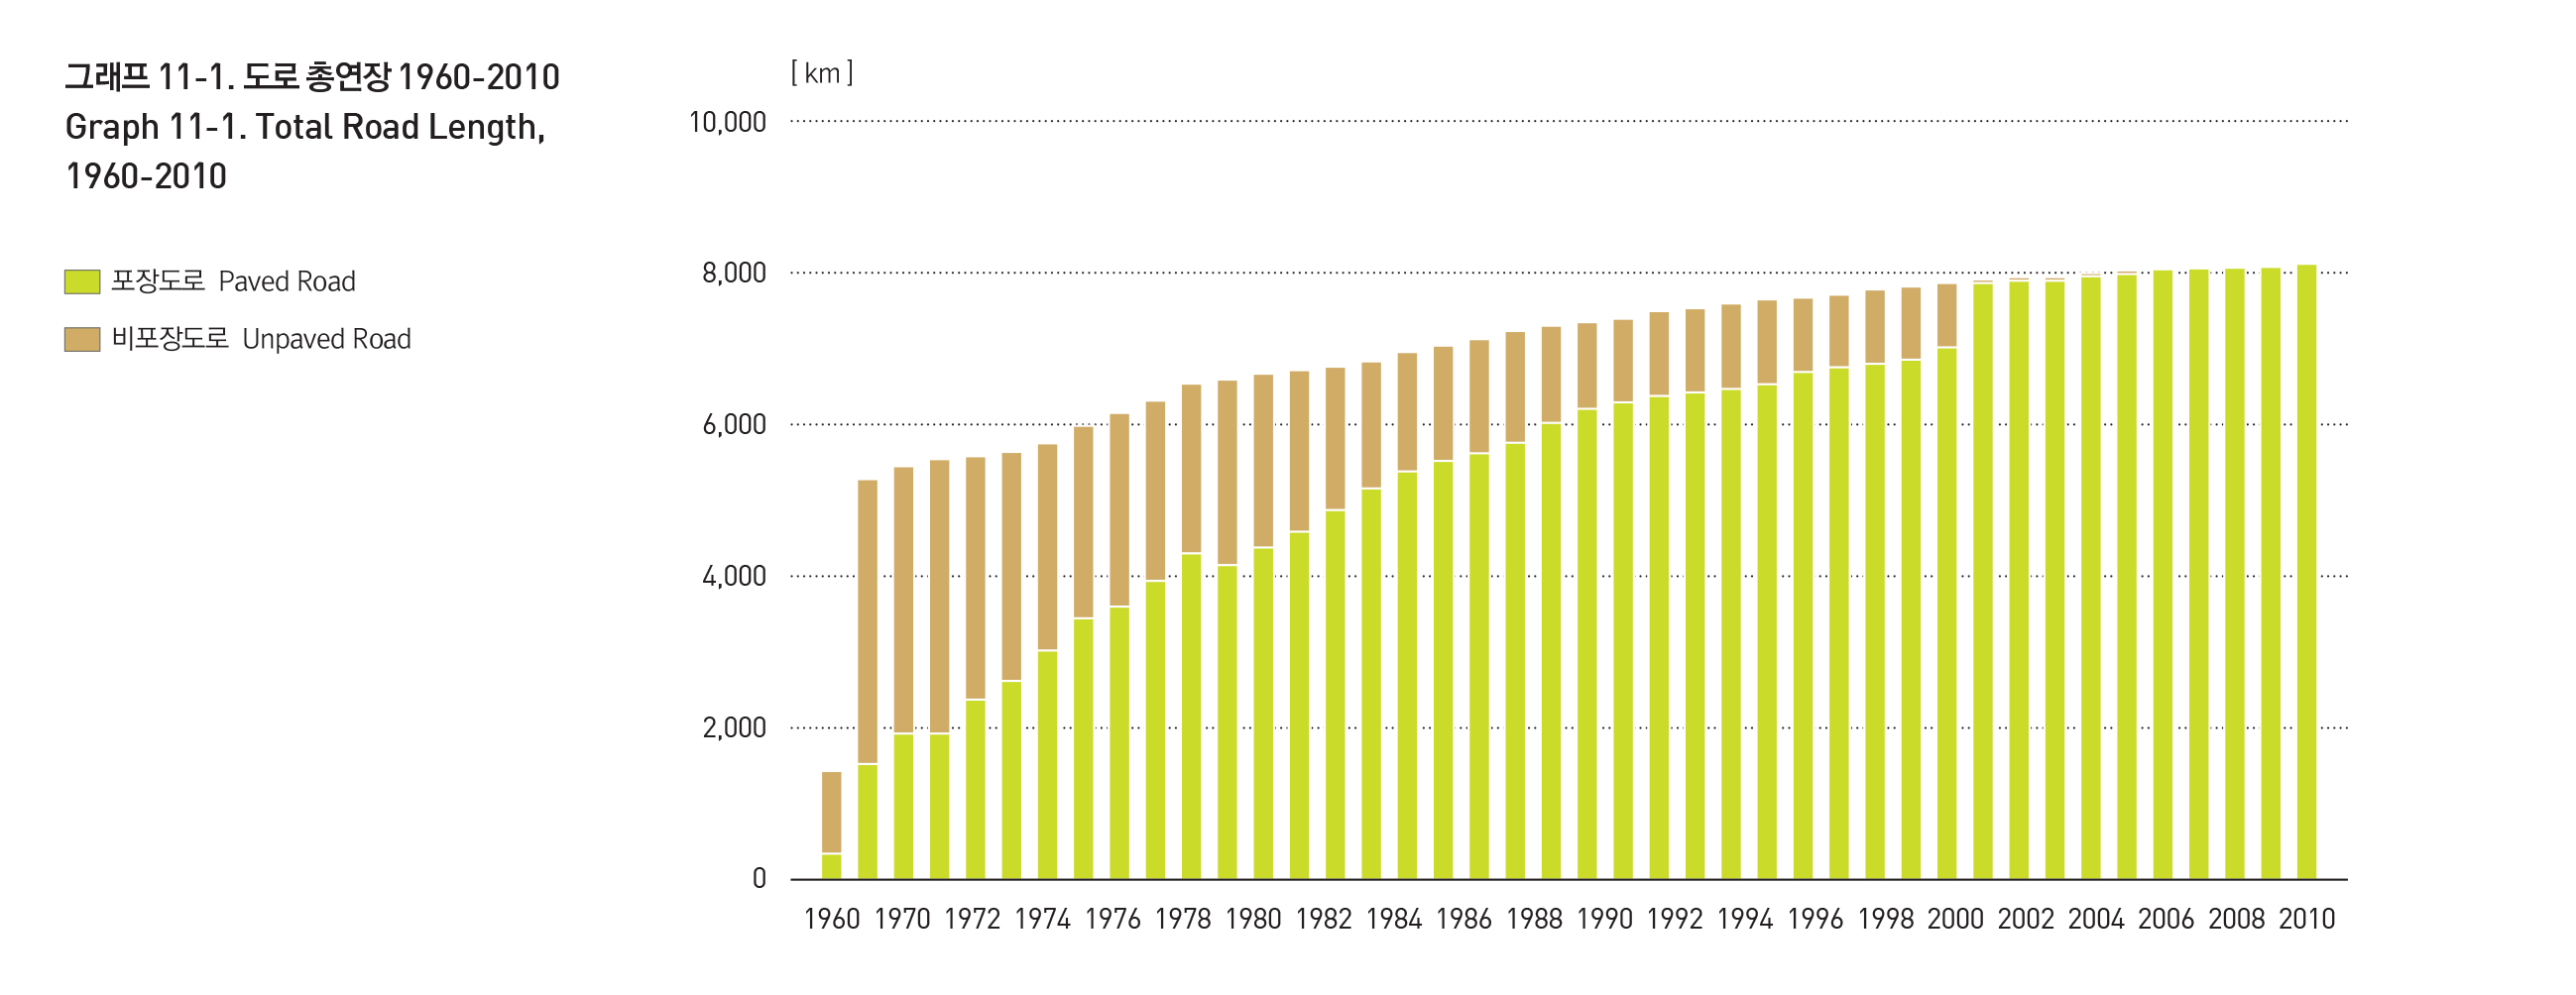
ROADS
Seoul’s road network is a combination of radial-, grid-, and ring-type roads, deriving its form from its unique history of development. Starting from the limited road installments inside the 4 main gates and in a few select outside regions, Seoul’s road network grew through the expansion into Gangbuk regions during the 1930s, the construction of grid-like road network of the Gangnam area in the 1980s, and the establishment of arterial roads and city expressways during the 1990s.
The total length of Seoul’s road system grew by a factor of 6.1 since 1960. Expressways, major arterial roads, and secondary arterial roads account for the major part of Seoul's traffic flow, making up 379.7km, 424.42㎢, and 589.22km each as of 2012.

Origin : Seoul Metropolitan Government, 2th Seoul Metropolitan Government road maintenance basic plan, 2012
Source: The Social Maps of Seoul in The Seoul Research Data Service http://data.si.re.kr/map-seoul-2013
Origin : Seoul Metropolitan Government, Seoul Statistics
Source: The Social Maps of Seoul in The Seoul Research Data Service http://data.si.re.kr/map-seoul-2013

Origin : Seoul Metropolitan Government, Seoul Statistics
Source: The Social Maps of Seoul in The Seoul Research Data Service http://data.si.re.kr/map-seoul-2013
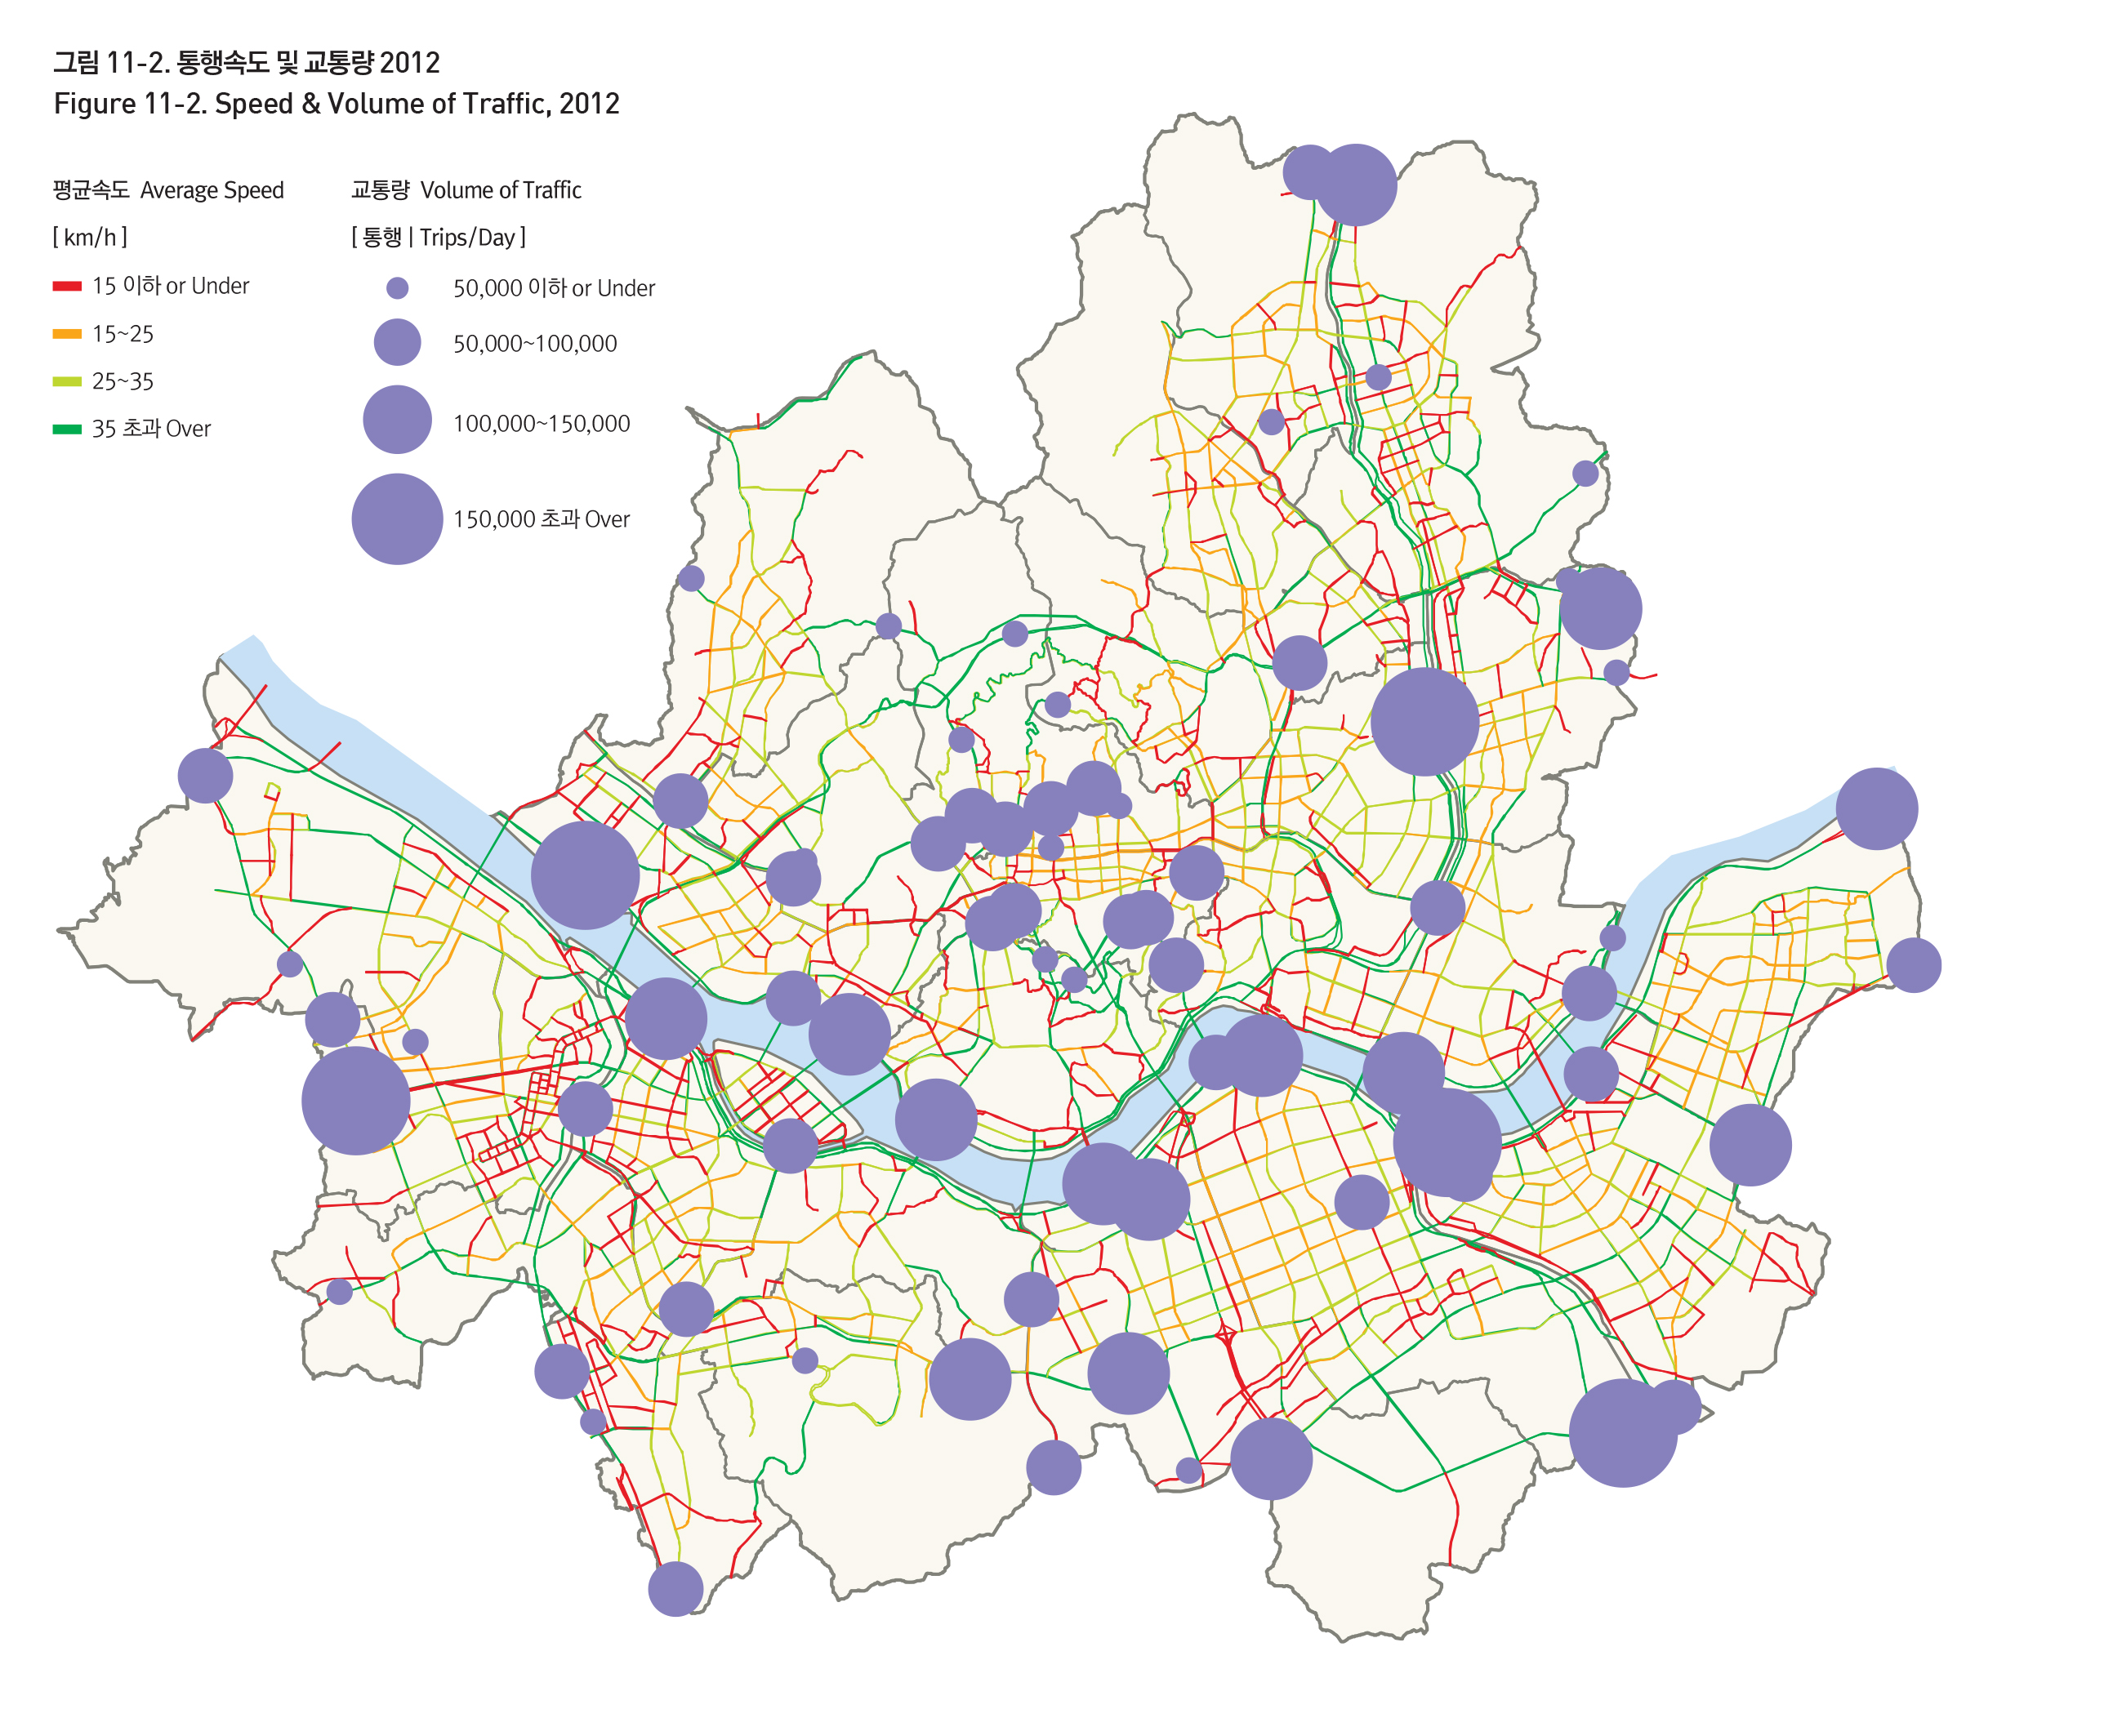
SPEED AND TRAFFIC VOLUME
Traffic speed is strongly linked with the number of registered vehicles and the volume of traffic. A figure of traffic speed and volume shows that average traffic speed is lower in areas with heavier volumes of traffic. The volume of traffic in Seoul has decreased by about 500,000 cars per day – in particular, downtown traffic diminished by 220,000 cars per day. The 1990s was a time of consistent growth in the number of registered vehicles and traffic volumes. As such, the average traffic speed in 1990 – 24.22㎞/h – went through a few fluctuations before plunging to 20.9㎞ in 1996. Afterwards, growth in the number of registered vehicles came to slow down, and as of 2010, Seoul’s average traffic speed stands at a much-improved rate of 24.0㎞/h.
Source: The Social Maps of Seoul in The Seoul Research Data Service http://data.si.re.kr/map-seoul-2013
Origin : Seoul Local Police Agency, Seoul Metropolitan Government Traffic Research, 2012
Seoul Metropolitan Government, Seoul Road Passing Speed, 2012
Source: The Social Maps of Seoul in The Seoul Research Data Service http://data.si.re.kr/map-seoul-2013

Origin : Seoul Metropolitan Government, Seoul Statistics
Source: The Social Maps of Seoul in The Seoul Research Data Service http://data.si.re.kr/map-seoul-2013

Origin : Seoul Metropolitan Government, Seoul Statistics
Source: The Social Maps of Seoul in The Seoul Research Data Service http://data.si.re.kr/map-seoul-2013
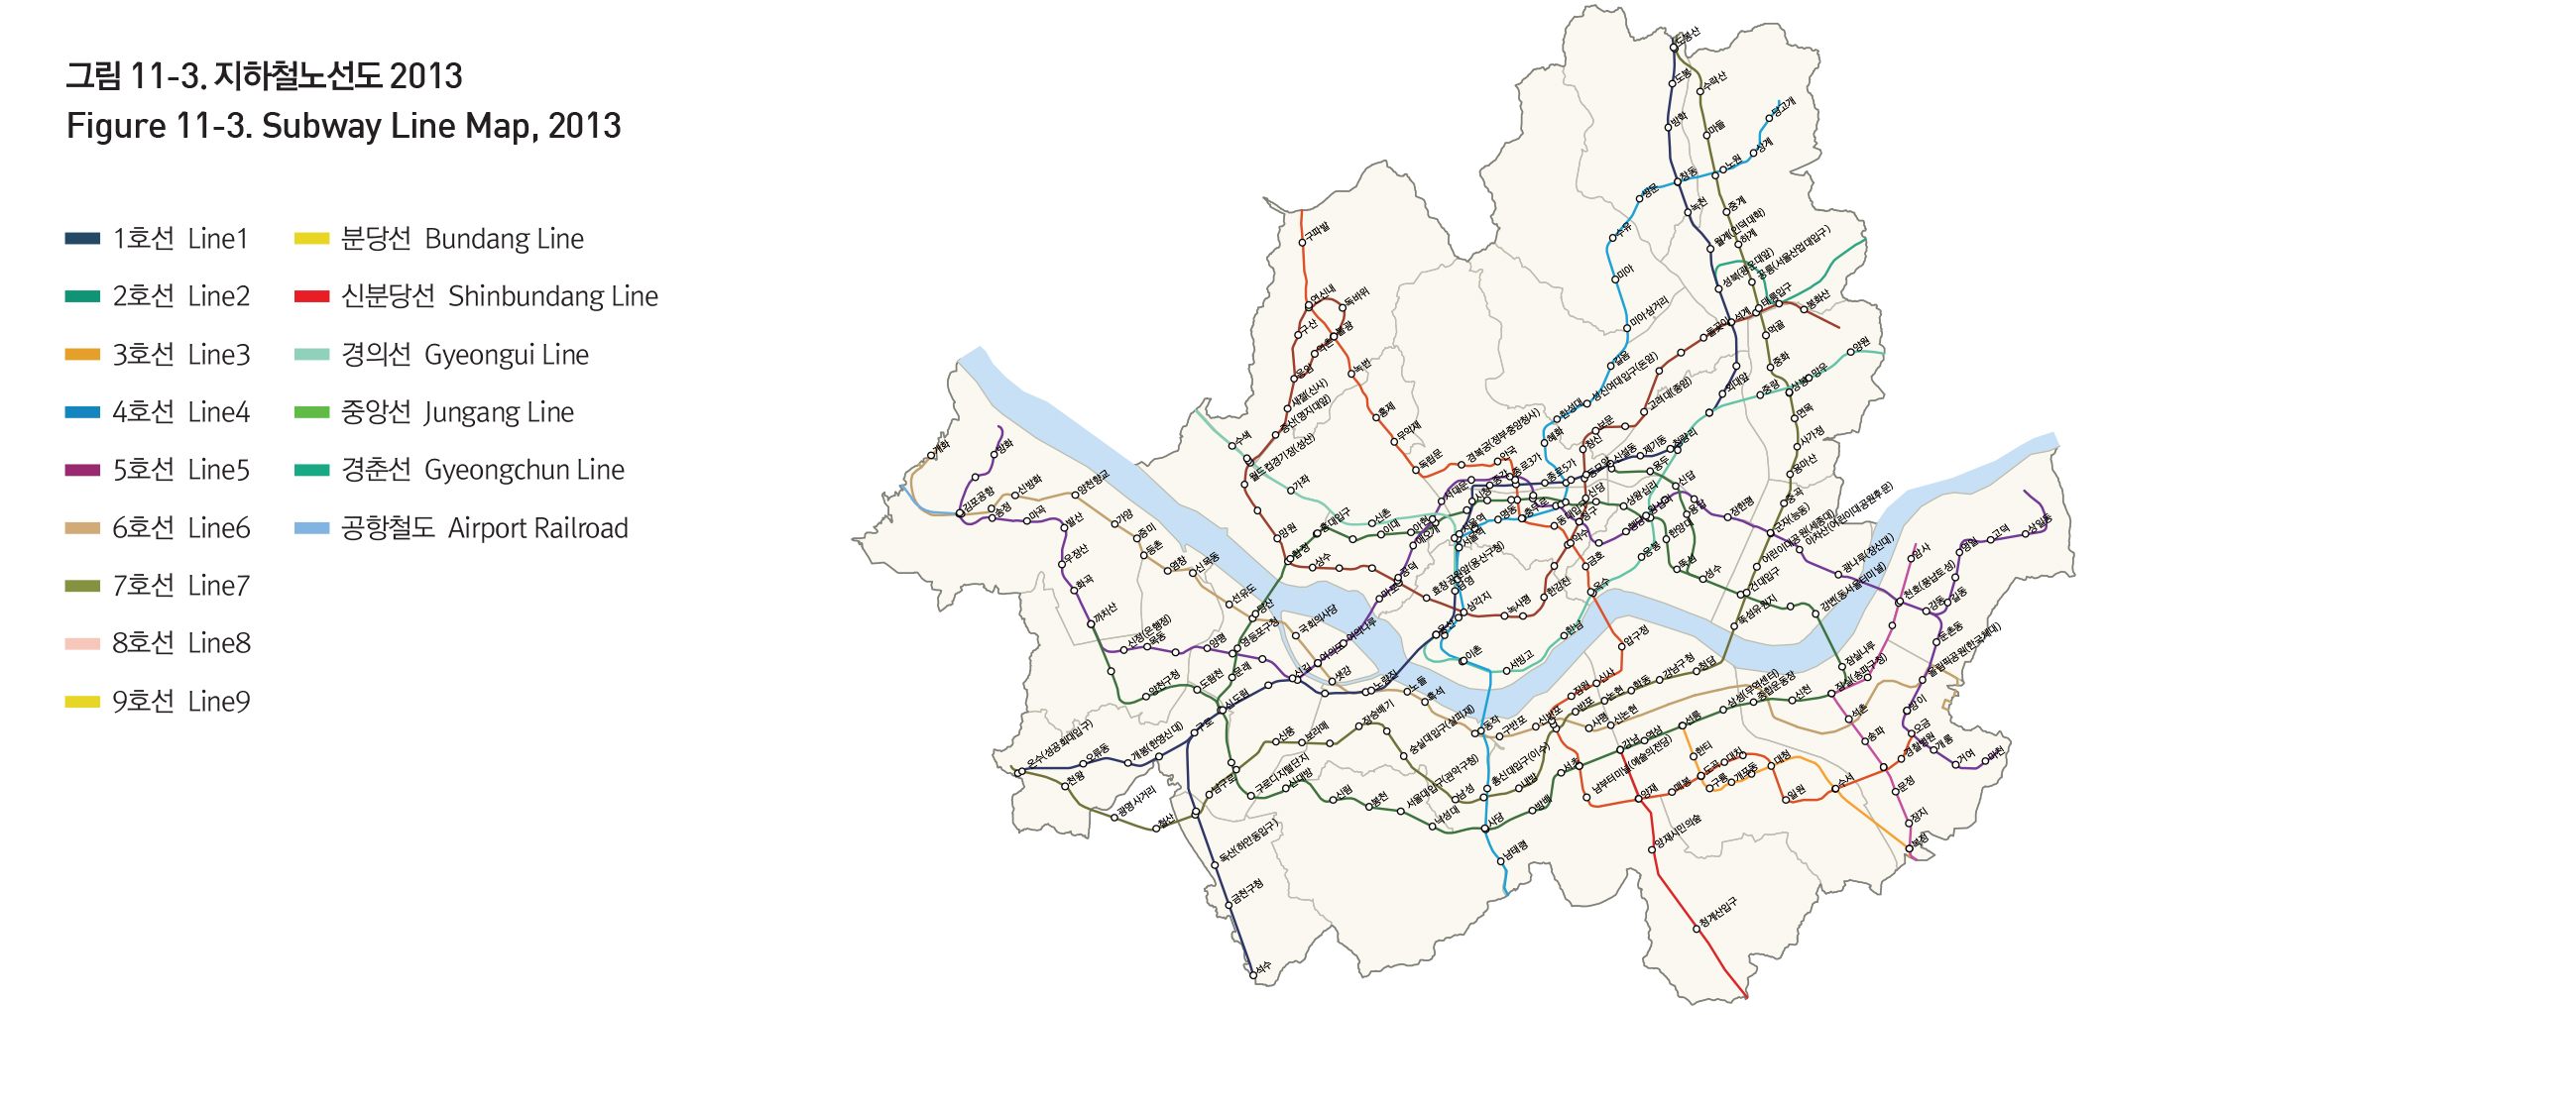
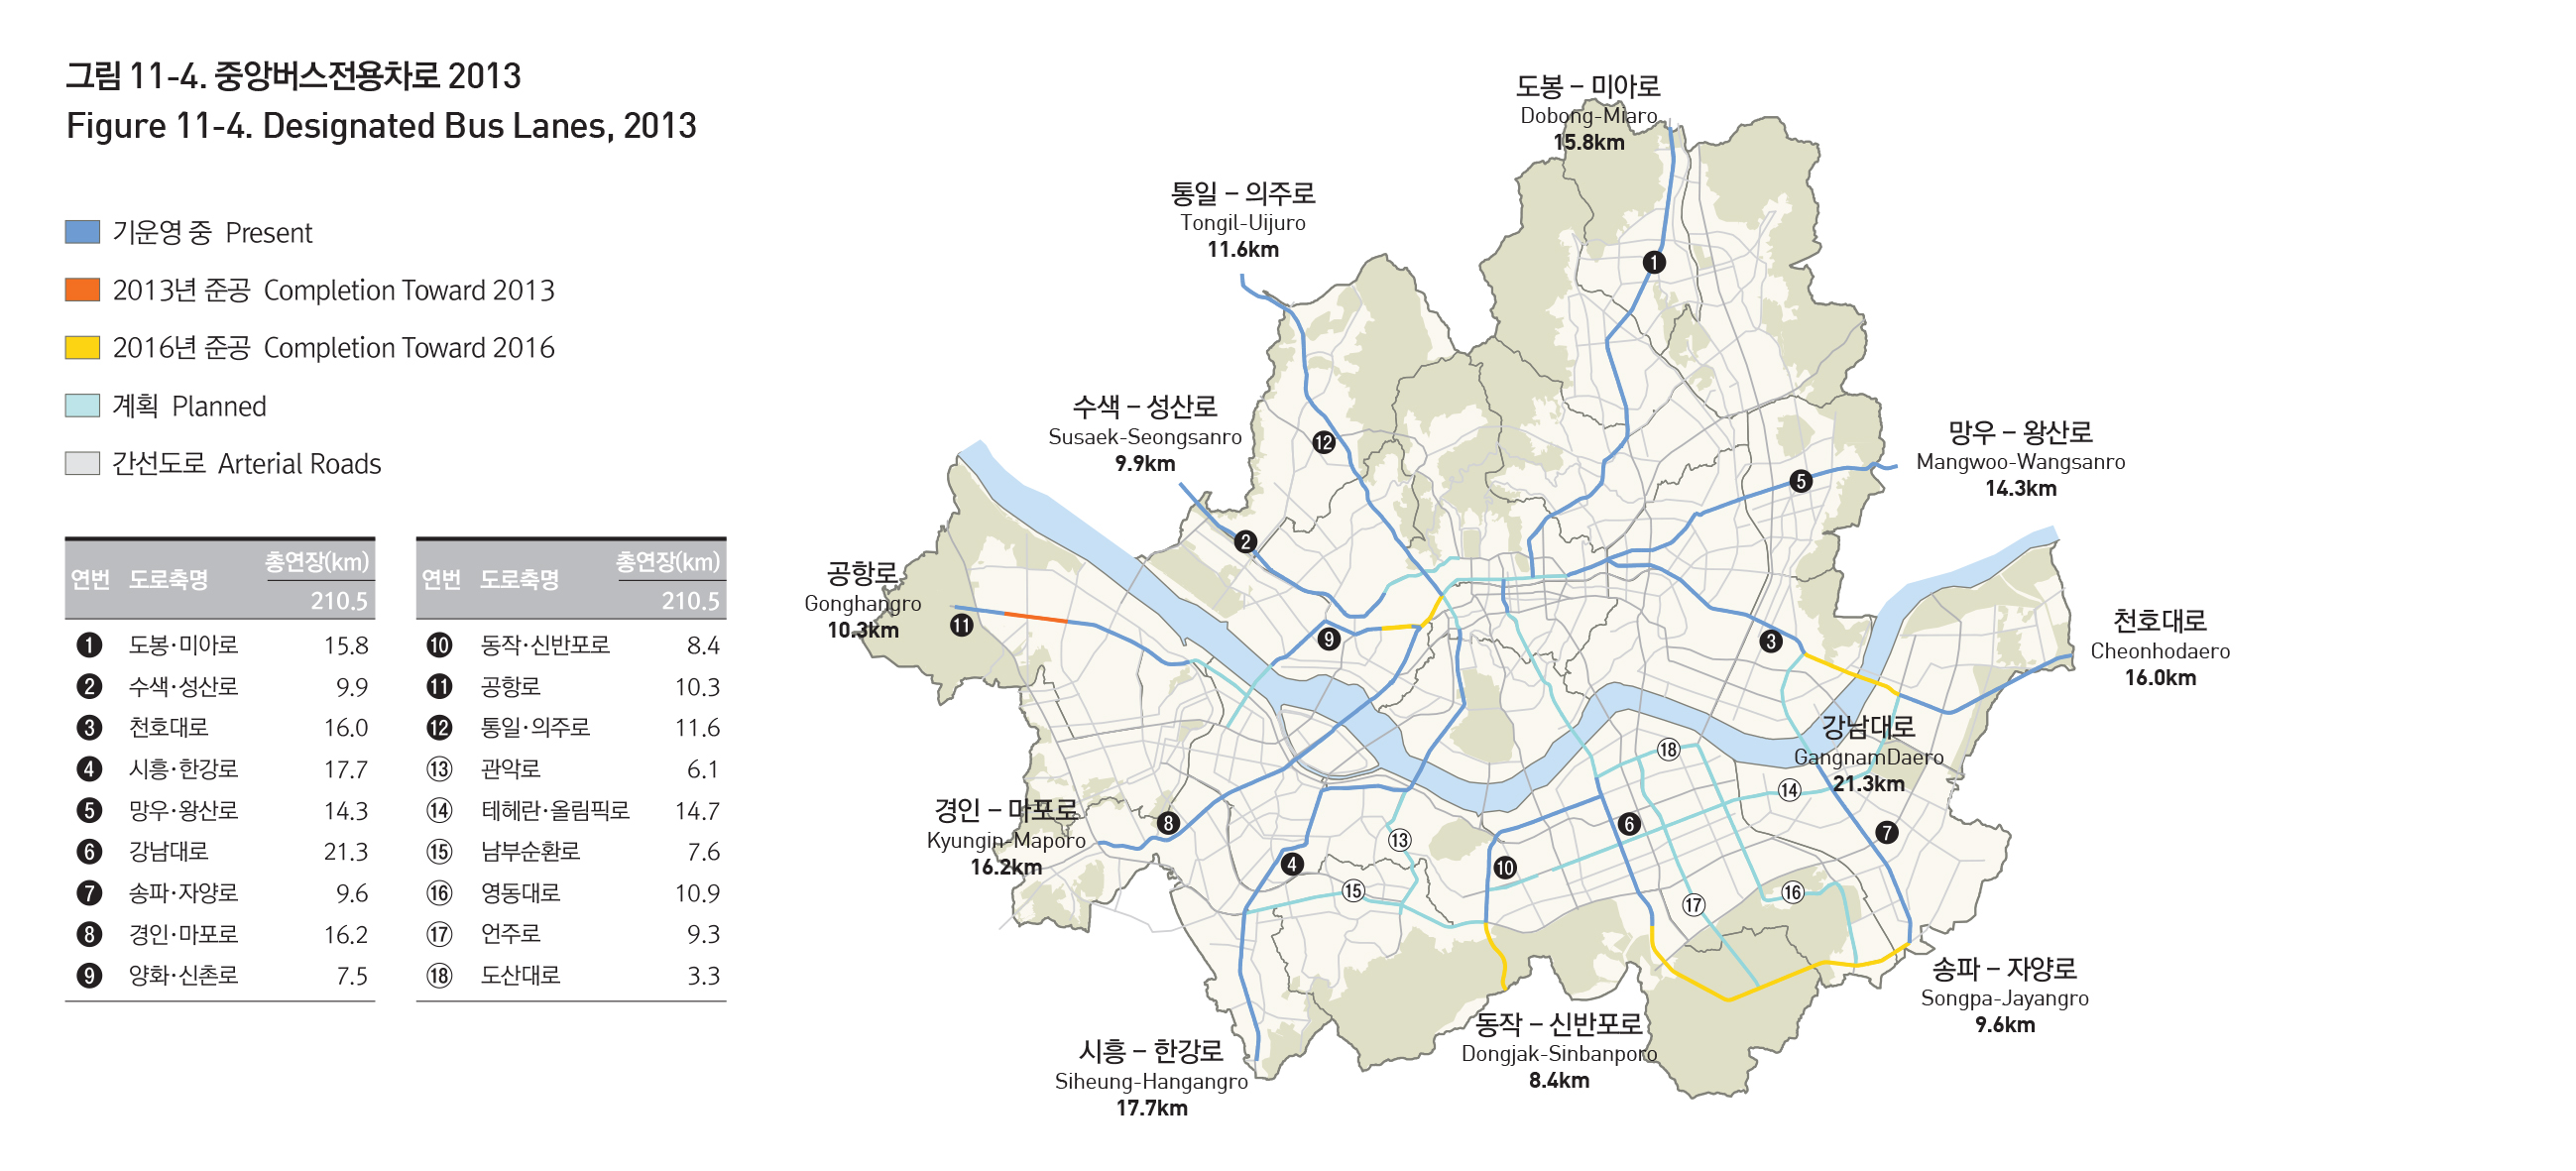
MEANS OF TRANSPORTATION
As of 2010, the figures for the share of transportation usage by type stand as follows: 64.3 % public transportation (buses 28.1%, subways 36.2%), cars (24.1%), taxis (7.2%). In general, public transportation makes up a huge share of transportation usage in Seoul. Ever since the overhaul of the public transportation system and the introduction of subway-bus transits in
July 2004, buses in particular have come to increase their share in total transportation usage. The length of the network of designated bus lanes stands at 115.3㎞ and has consistently grown, reflecting this change. Seoul's subway system began its construction in 1974 and currently spans 327.1㎞. Car usage has fallen since its peak in 2002 and currently stands at 24.1%, while the share of taxi usage consistently fell from 1996 onwards, but grew slightly in 2010 to reach 7.2%.
Source: The Social Maps of Seoul in The Seoul Research Data Service http://data.si.re.kr/map-seoul-2013
Origin : Ministry of Government Administration and Home Affairs, New Addresses General Map, 2010
Source: The Social Maps of Seoul in The Seoul Research Data Service http://data.si.re.kr/map-seoul-2013
Origin : Seoul Institute
Source: The Social Maps of Seoul in The Seoul Research Data Service http://data.si.re.kr/map-seoul-2013

Origin : Seoul Metropolitan Government, Headquarters of City Traffic
Source: The Social Maps of Seoul in The Seoul Research Data Service http://data.si.re.kr/map-seoul-2013

Origin : Seoul Metropolitan Government, Headquarters of City Traffic
Source: The Social Maps of Seoul in The Seoul Research Data Service http://data.si.re.kr/map-seoul-2013