Geo-spatial Information Service (GIS)
Introduction
Seoul Metropolitan Government (SMG) launched the Geospatial Information Service (GIS) project in 1995 to improve the quality of its service delivery. Since then, the SMG has relied on a Master Plan that laid out 4 distinct phases that would systematically and effectively guide the development of the digital map information system.
These processes have allowed the SMG to develop the structure and its application systems, such as the Space Data Warehouse, which is the integrated system of GIS, GIS portal, and the Data Reference Model. Keeping up with the IT development, SMG incorporated the User Created Contents (UCC), Web 2.0, Open Application Program Interface (API), and finally, built the Community Mapping Center to provide civil services through mobile platforms to accommodate user-led geospatial information services which emphasize citizen participation.
These processes have allowed the SMG to develop the structure and its application systems, such as the Space Data Warehouse, which is the integrated system of GIS, GIS portal, and the Data Reference Model. Keeping up with the IT development, SMG incorporated the User Created Contents (UCC), Web 2.0, Open Application Program Interface (API), and finally, built the Community Mapping Center to provide civil services through mobile platforms to accommodate user-led geospatial information services which emphasize citizen participation.
Policy Background
Government officers have to consider a dozen factors before they can decide how much tax to levy on a property; they would have to collect information from various sources to calculate the total land area, examine the surrounding area to estimate the value of the property, and decide how much they would tax the land.
A geospatial information system (GIS) can help with the analysis and the determination of the resources, such as land and capital, into the decision-making processes. GIS is a scientific tool that visually illustrates spatial information and helps with the efficient conduct of spatial investigation (Ganapati 2011). GIS is now significantly used in the governments, businesses, and researches for a broad range of applications including land use planning, infrastructure and utility development, demographic analysis and investigation of environmental resources, etc. Particularly, the use of GIS in local governments has considerably increased since the 1990s.
For example, the Seoul Metropolitan Government (SMG) has launched the GIS project in 1995, and has been using GIS to improve its policy applicability. Many GIS services offered by the SMG have already begun to provide a three-dimensional map service to the public. The SMG has aggressively applied the GIS platform in the decision-making process regarding how to utilize its surrounding land mass effectively. In fact, SMG has achieved top ranking in the Global E-Governance Survey of the SPAA at Rutgers University for the seventh consecutive time (Holzer and Manoharan, 2016). Therefore, this report will focus on the SMG’s GIS policies as a best practice to suggest policy recommendations regarding the facilitation of GIS policies for many cities in developing and undeveloped countries.
Policy Goals and Implementation Strategies
High Efficient Model of SMG’s GIS
The GIS of SMG launched from a comprehensive graphic information system development project in 1987 and was finally materialized with the establishment of Seoul GIS Part 1 and 2. The City of Seoul created a basic plan to build its own GIS platform but also collaborated with other agencies, including with the central government’s national GIS building project in 1995. Currently, Seoul’s GIS is being developed as part of the Seoul information project using the spatial information and geographical information. The goal of Seoul’s GIS is closely aligned to achieve the overall e-government policies, which is “To provide Citizens with Customized Public Services; Create Jobs; Build New Engines of Growth.”
In fact, the SMG has produced fundamental digital map products and developed various GIS application systems such as roads, urban planning information, water supply, sewerage, land information, geotechnical, underground facilities, and a new address management system. Recently, the Seoul has started to provide 3D map services and has put efforts to improve the accuracy of the digital maps and their measurements.
According to the survey by Won, Lee, Lee, and Hyeon (2011), SMG has received very high scores in terms of efficiency since the introduction of GIS. This is due to the fact that the utilization of GIS enables the SMG to reduce the working hours spent in drawing up documents regarding geospatial information. Moreover, since the Seoul Data Warehouse system (SDW) allows the sharing of geospatial information with other internal departments, other departments are also taking advantage of the information available in the SDW. These GIS initiatives have been developed in accordance with the GIS master plan of SMG.
Figure 3-1. Model of SMG’s Spatial Data Warehouse
.JPG)
GIS Strategies of Seoul Metropolitan Government
The specific GIS initiatives of the SMG, which are mentioned above, are based on the master plan of the SMG. In fact, the SMG’s GIS was first introduced in 1995 with the establishment of the SMG Master Plan and the revision of the National Geographic Information System (NGIS). During the First Step (1996-2001), the SMG completed the production of the digit map, which enabled numerous application systems to make use of the digit map.
In the second phase of the Master Plan (2002-2006), the development of the application systems introduced in the first stage have been completed. In this stage, Spatial Data Warehouse, which is an integrated system of GIS, GIS portal, Data Reference Model, and Standard Operating Procedure for developing applications were established. The SMG managed various administrative services based on GIS by utilizing 29 application systems such as the statistical map and the administrative area map. Moreover, the SMG rigorously reflected the space analysis results in its urban policies.
The SMG formed a ubiquitous environment by upgrading the existing application programs and introducing a new GIS technology such as User Created Contents (UCC), Web 2.0, and Open Application Program Interface (API) in the Step 3 (2007-2011).
In the Step 4 (2012-2016), the SMG built the Community Mapping Center and provided civil services through a mobile platform in accordance with a paradigm shift toward user-led forms of geospatial information emphasizing citizen participation. The SMG is providing more public sector information such as 3D indoor spatial information and other spatial information regarding maps, transport, land, environment, and public institutions. It is also providing map-based information on disabled-friendly facilities, current status of the new town development projects, free Wi-Fi zones and other services through the Map-Tagging Service. The Smart Complaint Register in the Seoul Map Website encourages citizens to participate actively in the administrative services by collecting data from them.
Implementation and Effects of Geospatial Information service
Government-to-Citizen (G2C)
“Government-to-Citizen (G2C)” is a new SMG initiative which emphasizes the importance of explaining the government policies or activities to the citizens. The Seoul Map Website and Smart Complaint Filing initiative are part of the G2C services, which were introduced to provide various spatial information regarding maps, transportation, land, environment, and public institutions. To be specific, it provides citizens with a variety of content types such as life information maps, statistics maps, and other spatial information created since 1995.
The SMG’s website of open space information provides the spatial information above for all citizens to use. Furthermore, the information includes the maps that private sectors do not provide such as foreign language based, building types, and ecology environments in Seoul.
The SMG’s website of open space information provides the spatial information above for all citizens to use. Furthermore, the information includes the maps that private sectors do not provide such as foreign language based, building types, and ecology environments in Seoul.
1. Seoul Map Website
The Seoul Map Website was built to make spatial information about various areas of Seoul available to the citizens and make it easy to check. Its function can be divided into various sub-functions; the ‘Map Service’, the ‘Urban Information Map Service’, the ‘Statistics Map Service’, the ‘Spatial Information by Field’, the ‘Spatial Information Education Center’, the ‘Make My Map’, and the ‘Smart Complaint Filing.’
Figure 3-2. Seoul Map Website
.JPG)
Source: Seoul Metropolitan Government (2015)
In terms of Map Service, it helps citizens not only to search maps by names or lot numbers, but also to search local welfare services, female employment opportunities, and children's facilities. Real time traffic information, aerial photographs, urban planning, etc., can be easily determined with the maps. People are able to check the actual size and distance with just a few clicks. Notes to particular parts of maps can be inserted. Maps can also be saved as images, emailed instantly or shared through SNS.
The Urban Information Map Service includes city and administrative district borders, bridges, road facilities, tunnels, pedestrian overpasses, public parking places and other facilities, rivers, parks, bird distribution charts, environmental information, and annual average temperatures.
The Statistics Map Service deals with data on population, housing, traffic, education facilities, and a variety of statistical information by year or region. Furthermore, spatial information in various fields, such as transportation, real estate, environment, cultural tourism, urban management, etc. are provided in the Spatial Information section by selecting specific field. Spatial Information Education Center supplies spatial information and map related learning contents, including the introduction of GIS and other study materials related to maps provided to the general public and to children.
Figure 3-3. Seoul Statistic Map and Location-based SNS Map Service
.JPG)
Source: Seoul Metropolitan Government (2015)
2. Smart Complaint Register in Seoul Map Website
The Smart Complaint Register service allows citizens to use the applications on their mobile devices to report a variety of complaints, such as sidewalk block damage, illegally dumped trash, illegally parked cars, and allows them to mark the exact locations on the map or attach photos. It is available both through the website and app.
Figure 3-4. Process of Smart Complaint Reporting
.JPG)
When complaints are received at the Seoul Smart Complaints Register, they will be filed and processed through the “120 Dasan Call Center.” In particular, if citizens’ complaints involve road and sidewalk damages, noises complaints, or female and child safety issues in certain areas, prompt actions are taken by the authorities to resolve them.
During the processing, the reports are received and the results can be viewed via smartphone or Internet website. The details of the process, including total time elapsed or expected time to resolve the complaints are also sent via SMS to a registered phone number. Since the initial phase of the application ‘Smart Complaint Register,’ 760,000 cases were registered via this application. Among the registered cases, 280,638 cases were reports of illegal parking which takes the greatest proportion, 157,728 cases were about illegal advertisements, 88,915 cases were about illegally dumped trash, 51,698 cases were about damaged roads, and 28,732 cases were about destroyed sidewalk block.
3. 3D Indoor Spatial Information
Information about indoor spatial information has been raised. Thus, the SMG started to building 3D indoor spatial information in terms of overall the city such as subway stations since May 2013. A pilot project for web service launched in September 2013 and the initial project included three subway stations and three public buildings. This project aimed to provide indoor datasets in order to provide available information about public safety and navigations to citizens. Currently, the SMG has expanded to the service targets of the “Seoul Map Service” through mobile applications. The SMG has made public various data so that the private sector can utilize it and produce several contents in terms of cultural and sightseeing facilities. Moreover, 3D indoor information service enables for disabled people and senior citizens to approach to the public service more easily. In addition, it is used for fire drills of a head office of firefighting through a safety map for firefighting for the public safety.
Figure 3-5. Examples of 3D indoor modeling
.JPG)
Source: Seoul Metropolitan Government (2015)
Figure 3-6. Linkage of 3D Indoor Spatial Information with the Fire Safety Map
.JPG)
This 3D indoor modeling service is currently conducted and provided by private corporations directly, while the Seoul Metropolitan Government plays the role of supporting this service by funding or providing fundamental data. Furthermore, 3D indoor modeling service plans to support the most vulnerable members of society, such as the elder citizens and the disabled, by providing addition information regarding access to transportation, as well as providing interior display or a fire safety map of buildings for safe evacuation.
4. Infrastructure of Spatial Information
1) Introduction
The Government 3.0. which has the key word such as openness, sharing, communication, and collaboration, has tried to communicate and collaborate with citizens rather than simply making public information. In this context, about 80% of total public information should be related to location and geospatial information for communicating with citizens. Therefore, the SMG built LBS(LOCATION BASED SERVICE), which can be used through the smart phone, for enabling the citizen to comprehend the public administration better.
Figure 3-7. Configuration of Geospatial Service Infra
.JPG)
The LBS (Location-Based Service) has a common function such as expansion, reduction, and coordinate transformation as a service with information on the map while it spends relatively more time and money. Therefore, the SMG built the Geospatial Information Platform to save time and money by enabling each department to use common functions and multilingual maps.
In addition, the Seoul Map-Tagging service makes non-specialists change the text-based information into location based information, which is the key role of the platform. The geospatial theme based on this platform are providing basic location based services though “Seoul Map-Tagging Share Center” via the tablet PC and laptop without fees under the department of municipalities. The geospatial information theme can be used in schools and corporations as well as citizens through the open API.
2) Elements of GIS infrastructure
This part introduces how to provide the ability to convert text information to spatial information will increase citizens’ understanding of Public Administration.
First of all, the platform is providing three parts: 1) Basic functions of maps, 2) Multi-lingual Map offering Korean, English, Japanese, and Chinese (both complicated and simplified Chinese), 3) Changing address (a road name and a lot number) into a broad coordination, which are offered by the Open API.
First of all, the platform is providing three parts: 1) Basic functions of maps, 2) Multi-lingual Map offering Korean, English, Japanese, and Chinese (both complicated and simplified Chinese), 3) Changing address (a road name and a lot number) into a broad coordination, which are offered by the Open API.
Figure 3-8. Infrastructure of SMG’s geospatial service and process
.JPG)
Based on this service, ‘Smart Seoul Map’ via smartphones and other application, and ‘Seoul Map-Tagging Share Center’ also are provided.
Second, the Smart Seoul Map enables the smartphone users to utilize services based on Android and IOS types of software and provides participating theme service as well as location based services of contents. Each department can offer the location based services in terms of public information to the smartphone users without fees.
Figure 3-9. Introduction of Smart Seoul Map
.JPG)
Finally, for private developer such as citizens, the map provided the board which copes with Open API of the platform, and Software Develop Kit (SDK), and Q&A through ‘Seoul Map-Tagging Share Center’. This is composed of four factors, which are (1) ‘Seoul Map Tagging’ providing administrative services with the map tagging, (2) ‘OpenAPI’ which explains how to use the OpenAPI, (3) ‘Sharing and Collaborating Community’ providing a board of instructors and Q&A, and (4) ‘Theme Gallery enabling people to be able to glance at the themes of map tagging at one time. The major characteristic of this web service is to provide function to make link to homepages and blogs by copying web services of each theme. Thus, several departments of the SMG can serve the function through the link of each homepage.
Figure 3-10. Homepage of ‘HTTP://MAP.SEOUL.GO.KR/’
.JPG)
Figure 3-11. Seoul Map Tagging
.JPG)
Figure 3-12. OpenAPI
.JPG)
Figure 3-13. Seoul Map-Tagging Share Center (Board)
.JPG)
Figure 3-14. Theme Gallery
.JPG)
Without any infrastructure, such as the “Smart Seoul Map,” each department would waste time and money to develop applications individually. In fact, these departments are saving money in maintain H/W and S/W from year to year. Each department induces the citizens’ participation in their tasks more actively with the geospatial infrastructure by providing their information to the public. Currently, this infrastructure is related to other 43 initiatives, such as Seoul Do-Dream Roads, Information Sharing Center, Seoul Homepage, Seoul Sightseeing Homepage, Legacy of Future Webpage, and Pavement Management System (adding 19 in 2016).
The picture shows the Smart Seoul Map and Sharing Center enable people to get services through applications and webpages without additional development of the website of each department.
Figure 3-15. Homepage of ‘Green Road (Nokeumgil)’ using Web-Link
.JPG)
Figure 3-16. Hompage of ‘Han-River Monddaing’ providing GIS using Iframe

Therefore, the geospatial platform service play a positive role in enabling for the citizens to understand public information in terms of public administration by changing text-baed information into the geospatial information. Using this platform, each department could estabilish its own geospatial information and standardized location-based information. In the furture, when citizen’s participation is more expanded than before, the map tagging services could make the citizens register their information and know-how in term of geospatial information and share them with members of the SMG.
5. Map Tagging Service
The prominent function of the geospatial platform is the Map-Tagging function. A public officer of the city inserts the locational information of status including ‘Location Reference System’ in the excel type of files and makes the geospatial information available for being served. Non-specialists could correct, delete, and add the information easily.
Figure 3-17. Effect of Seoul Map Tagging

From 2013 to 2016 December, about thirty departments of municipalities are utilizing the map-tagging service for providing public services with the citizen. The map-tagging services include the major investment initiatives, Seoul Circle Roads, facilities for bicycle, changing public administration of the SMG, flower streets in Spring/green streets in Summer/colorful streets in Fall, and other 105 kinds of services (adding 32 types of services in 2016).
Figure 3-18. Best Practice of Seoul Map Tagging

Map-based spatial information is much easier to understand and use than text-based information. Thus, the Seoul Metropolitan Government is fully using "Seoul-type Map Tagging" services for a whole array of its public services to enhance its citizens' convenience.
In 2013, the SMG launched mobile location-based services to inform citizens of the diverse events and facilities in the area, such as information of shelters from the summer heat for children and senior citizens. This map-tagging services currently include 105 kinds of services, such as the major investment initiatives, Seoul Circle Roads, facilities for bicycle, and colorful streets in Fall. Citizens can also participate in the map tagging services. They can make proposals for new services or create and register their own content for new services.
The provision of map tagged spatial information, if map services are registered into the map tagging service, can be operationalized without additional costs to other departments. In addition, according to the completion of the 2016 initiative, it is possible to offers various services to revitalize the geospatial information platform through the diversification of supporting devices and to use in tablet PC and computer by adoption of reaction type web design tech.
Figure 3-19. The Reaction Type of Web Map Service

Furthermore, the Map-Tagging could confuse the user because it indicates only exits for the several buildings in one address such as apartments. For example, the pre-elementary schools are indicated as the major building or exits of apartments currently. However, according to the completion of the 2016 initiative, it could be map-tagged based on own address information in the future. Figure 3-20. Seoul Map – Tagging Share Center
Figure-20. Seoul Map-Tagging Share Center

Source: Seoul Metropolitan Government (2015)
Process of Geospatial Informatino Service Initiatives
| Domains/ Masterplan |
Land | Facility | Transportation | Environment | Disaster Management | Urban Planning | Life information | Civil Service & Participation |
| Step 1 1996-2001 |
Integrating 16 underground facility data | Integrating 16 underground facility data | Integrating 16 underground facility data | Integrating 16 underground facility data Validity analysis of Urban Landscape Plan |
||||
| Step2 2002-2006 |
Integrated management system (IMS) based on web of undergrounding facility data A GIS portal system based on the web (Seoul Map Webpage) |
A GIS portal system based on the web (Seoul Map Webpage) Collecting data for 3D indoor spatial information |
A GIS portal system based on the web (Seoul Map Webpage) | A GIS portal system based on the web (Seoul Map Webpage) | Integrated management system (IMS) based on web of undergrounding facility data | Collecting data for 3D indoor spatial information | A GIS portal system based on the web (Seoul Map Webpage) | |
| Step 3 2007-2011 |
Accuracy improvement of underground facility data | GIS portal system through Open API 3D indoor geospatial information providing civil service Accuracy improvement of underground facility data Mobile GIS Platform (Geospatial Information Platform) |
GIS portal system through Open API | Mobile GIS Platform (Geospatial Information Platform) | Mobile GIS Platform (Geospatial Information Platform) | GIS portal system through Open API 3D indoor geospatial information providing civil service Mobile GIS Platform (Geospatial Information Platform) |
3D indoor geospatial information providing civil service Mobile GIS Platform (Geospatial Information Platform) |
|
| Step 4 2012-2016 |
Smart Complaint Register in Seoul Map Launching Map Tagging Service Smart operation for 3D indoor geospatial information (Geospatial Information Platform) |
Smart Complaint Register in Seoul Map Launching Map Tagging Service |
Smart operation for 3D indoor geospatial information (Geospatial Information Platform) | Smart operation for 3D indoor geospatial information (Geospatial Information Platform) | Smart Complaint Register in Seoul Map Launching Map Tagging Service Smart operation for 3D indoor geospatial information (Geospatial Information Platform) |
Smart Complaint Register in Seoul Map Launching Map Tagging Service Smart operation for 3D indoor geospatial information (Geospatial Information Platform) |
Case Study
The U.S. Environmental Protection Agency (EPA)
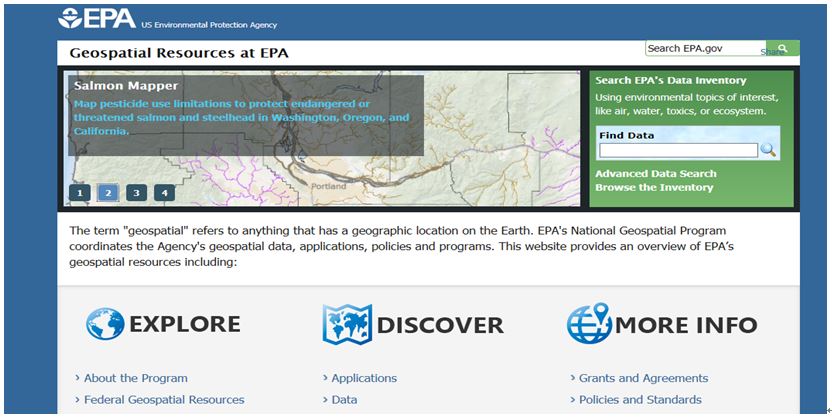
The EPA webpage allows users to use the web-based GIS through Environmental Dataset Gateway (EDG). It allows every user who enters the website to search, find, and access geospatial resources produced by EPA’s program. Moreover, it connects other available geospatial metadata through ‘DATA.Gov’ and ‘GeoPlatform.gov’. A number of geospatial applications of EPA, such as ‘Air Quality Tools,’ ‘Water Quality Tools,’ ‘Neighborhood Tools,’ and ‘Waste Tools,’ enable users to approach and utilize various kinds of geospatial data (www.epa.gov).
Figure 3-21. Various geospatial resources at EPA (Source: www.epa.gov)
The U.S. Geological Survey (USGS)
The USGS allows all users to download free bulk of maps and geospatial data. It has contributed to the dissemination of geospatial data for the emerging GIS technological community by providing reliable data at low cost. Currently, the USGS offers primary resources of free geospatial data and a linkage to primary sources of geospatial data, such as ‘The National Map’, ‘Earth Explorer’, and ‘GloVis’ (www.usgs.gov).
Figure 3-22. USGS Website
.JPG)
Figure 3-23. Eight base layers of The National Map
.JPG)
Source: William J. Carswell (2012)
The National Map provides basic geospatial information which describes the types of landscapes of the United States, including elevation, boundaries, geographic names, hydrography, land cover, orthoimagery, structure, and transportation, through a number of applications and other services. It contains digital and print versions of topographic maps, geospatial data services, online viewing, and data download services (William J. Carswell, 2012).
The Environmental Systems Research Institute (ESRI)
The Environmental Systems Research Institute (ESRI) is an international institute which provides programs and services related to geographic information system. Currently, the ESRI provides about fifty percent of total GIS software worldwide and operates ten regional offices in the U.S. alone. The ArcGIS is the one of the major software of ESRI and is offered in both desktop and mobile versions. The ArcGIS provides a variety of capabilities, such as mapping and visualization, spatial analysis, imagery and remote sensing, big data, real-time GIS, data management, geo-design, and community engagement, etc.
Figure 3-24. ESRI Website

STAGE (STAtistics & GEography), the Republic of Slovenia
The Statistical Office of the Republic of Slovenia has developed an integrated system for the provision of geospatial statistics through an instrument called STAGE, which stands for STAtistics and GEography. This application system deals with a broad range of variables collected and developed by different levels of administrative units.
Furthermore, this application utilizes a hierarchical grid to disseminate geospatial statistics as an open free geospatial statistical data source. The role of STAGE which produces and disseminate geospatial data is evaluated as one of the greatest contributions of official statistics to broad adaptation of geospatial data by user groups in Slovenia (United Nations, 2016, Economic and Social Council Report).
Furthermore, this application utilizes a hierarchical grid to disseminate geospatial statistics as an open free geospatial statistical data source. The role of STAGE which produces and disseminate geospatial data is evaluated as one of the greatest contributions of official statistics to broad adaptation of geospatial data by user groups in Slovenia (United Nations, 2016, Economic and Social Council Report).
Figure 3-25. The number of one-person households

Source: United Nations, Economic and Social Council Report, 2016
Figure 3-26. STAGE on Twitter
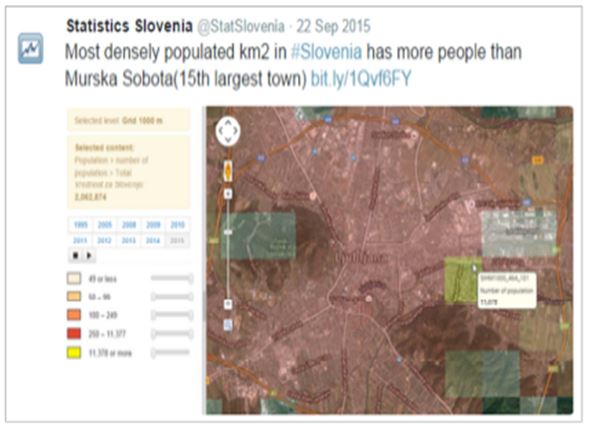
Source: United Nations, Economic and Social Council Report, 2016
Challenges and Opportunities
This section of the study attempts to illuminate the drivers and barriers of GIS development in the Seoul Metropolitan Government case, which could serve as a guideline and strategy for GIS implementation in developing countries. The evolution of GIS has focused on resolving other related issues such as transparency, accountability, citizen engagement, dissemination, privacy, etc.
More specifically, Shark (2015) suggested that GIS is providing more access to information about the activities of government so that it can support transparency and lead to progress safety and security. Drew (2000) argued that utilization of GIS could promote transparency in decision-making process. Furthermore, many research showed that e-Government is increasingly being used to improve transparency in the public sector and to combat corruption (Kim, Kim & Lee, 2008). In terms of citizen engagement, GIS is one of the fundamental technologies facilitating decision-making process in the government.
GIS has also gradually become more accessible and user friendly, therefore significantly contributing to the increase of citizen engagement. Clark, Brudney, and Jang (2013) demonstrated in the 311 call system in the Boston example that citizens can play a complementary role in detecting and reporting the gap in the government services and provide helpful comments to the government.
Haque (2001) claimed that in the short term, it is obvious that GIS seems to provide better efficiency during the policy implementation process through quicker access to data and a more efficient distribution of information. On the other hand, public officials also need to deal with the broader implications of GIS as they try to accommodate democratic values (Haque, 2001). Although GIS offers valuable information to the decision makers, there are a few limitations associated with it.
Similarly, Public Participation GIS (PPGIS) is becoming important with regard to discussions about the future of GIS. Particularly, GIS enables public participating mechanisms in collaborative mapping exercises and even decision-making. According to Ganapati’s (2011), there are three waves in the evolution of GIS technology for public participation: desktop-based GIS, web-based GIS, and finally the Geospatial Web 2.0 platform. The waves represent progression of the GIS technology from being understood by expert professionals to being understood by citizens. Ganapati (2011) contended that limited use of PPGIS for higher levels of participation was found even though “barriers to PPGIS adoption for decision making seem less technological and more institutional.”
These issues mentioned above could be indicators suggesting the challenges and opportunities surrounding the use of GIS.
1. Drivers for the GIS
The Seoul Metropolitan Government (SMG) case of GIS reveals that the incentives, or drivers, for the implementation of GIS services are very complicated. Some drivers come from within the government, while others originate from outside the government, and the government is left to take a rather reactionary stance. Each of the drivers is discussed below.
1.1. Open Government, E-government and Transparency initiative of current administration
The Open Government and Transparency agenda or initiatives of the government could be a significant factor in facilitating the GIS services. For example, SMG’s GIS policies are based on the initiative or agenda in terms of Open Government, e-Government, and Transparency. More specifically, all executive departments in the SMG had to come up with Open Government plans and indicate how they will share and utilize geospatial information in innovative ways. Compared to the SMG’s e-Government master plan, geospatial information initiatives have strictly followed the development stages laid out in the Master Plan.
1.2. Active crowdsourcing platform bring participation of citizens
Various GIS services could be largely affected by the crowdsourcing of citizens as well as government policies. In other words, the place that enables the citizens to create geospatial data and to share it could bring about development of a number of GIS services such as ‘Bing.com’. Microsoft’s search engine Bing.com utilizes public health data by geographic location and shows the results on a geographic map. Furthermore, citizens can augment their information to the official government information on the website and evaluate hospitals of private sector health providers.
Figure 3-27: Health data applications (http://health2apps.com)
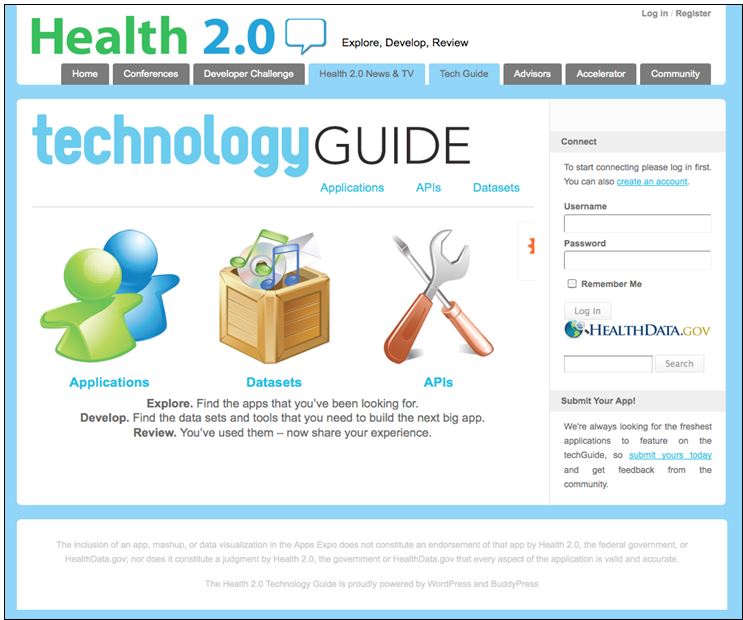
This example shows that providing a crowdsourcing platform could be an important factor in drawing the participation of the citizens and in constructing geospatial data required by the GIS policies.
1.3. Low risk related to content authority
Most geospatial data used in the public sector has informational and educational purposes. Considering the case of the Seoul Metropolitan Government, these data-sets are non-transactional and therefore content authority belongs to government. This means that there is a low risk for government to get involved. Moreover, constructing data and sharing information with citizens would help government increase transparency and accountability in the long term. This is attributed to the fact that the more geospatial data is available and the more citizen developers can experiment with the existing open data, the more useful applications in terms of GIS will emerge and ultimately lead to higher transparency and accountability of government.
1.4. Increased use of smartphone and tablet PC
Increased use of smartphone and tablet PC enables people to participate in producing, editing, and eliminating information everywhere. In fact, more than 90 percent of citizens in Seoul are smartphone users. Experts project that innovative technology could contribute in the development of the GIS. The development of technology might facilitate the provision of geospatial services to citizens. This is primarily due to the current data services including GIS of the Seoul Metropolitan Government being possible because of the relative uptake of smart phone users.
1.5. Increased use of social networking services
Concerning the trend of smartphone use, the City of Seoul also has a new trend to co-produce and share data and information in general. According to Lee (2014), 55.1% of all Koreans above the age of six used social networking services (SNS) to access information in 2013. This has led to an increase in online connectivity, in time spent on social networking services, and the increased importance of sharing geospatial information.
For example, people can utilize GIS such as the Smart Complaint Filing Service in Seoul Map Website and Seoul Map Tagging Service and share their opinion regarding GIS through their social networking sites, social media applications or online. This fact implies that the Seoul Metropolitan Government will be able to reach citizens through the social networking services and that citizens are more likely to access government geospatial information through these services.
For example, people can utilize GIS such as the Smart Complaint Filing Service in Seoul Map Website and Seoul Map Tagging Service and share their opinion regarding GIS through their social networking sites, social media applications or online. This fact implies that the Seoul Metropolitan Government will be able to reach citizens through the social networking services and that citizens are more likely to access government geospatial information through these services.
1.6. High receptiveness to external innovation
Local governments in Korea have had to face larger mandates, increasingly complex tasks and large budget cuts due to economic and social conditions. Some governments even have budget freezes and therefore have little or no capacity to innovate. In the past, governments could employ additional consultants or use their budget to hire external experts to bring innovations into government. With the advent of social media, this situation has changed and it is now possible to attract free innovations flowing into government from the outside. Therefore, government has become more receptive to innovation from external sources, producing and sharing public data such as geospatial information.
1.7. Expectation of the public
The general climate in Korea toward government is relatively negative. According to the result of a survey conducted by the Seoul National University in 2014, more than fifty percent of citizens do not trust their government. The current Administration has therefore explicitly called for efforts to “restore trust in government.” In fact, many past administrations have called to the public and asked the government to allow innovative ideas to flow in and have highlighted that people should look into themselves as competent and innovative leaders. This escalates the incentives for the government to be innovative and generally allows for a climate of innovation and openness such as making geospatial information public.
1.8. Skilled public officials in the next generation
With the expectations of citizens and a general innovation climate in the government, anticipated expectations of the next generation of government employees could be a driver for facilitating GIS in the government. The incoming cohort of young government employees is expected to be more tech-savvy than any previous generation, especially in terms of geospatial information. This is due to the fact that job opportunities in Korean government are highly competitive compared to private or nonprofit sector job opportunities. Therefore, the government would employ and select people who are skilled with the current social networking services and application programs that will allow future government to provide higher quality of geospatial services to citizens to fulfill their needs.
| # | Eight drivers for the implementation of GIS |
|
|
Open Government, e-Government and Transparency initiative of the current administration |
|
|
Active crowdsourcing platform can bring the participation of the citizens |
|
|
Low risk related to content authority |
|
|
Increased use of smartphone and tablet PC |
|
|
Increased use of social networking services |
|
|
High receptiveness to innovation |
|
|
Expectation of the public |
|
|
Skilled public officials in the next generation |
2. Barriers for the GIS
2.1. Diffusion of smartphones in undeveloped and developing countries
The affordability and diffusion of smartphones in Seoul is expected to increase in the near future, however, smartphones and subscription to data plans, are very expensive and therefore not widely used in other rural areas of Korea.
Choi et.al. (2014) showed that the percentage of diffusion of smartphones was 66.2% in 2013 and all cellphone users will have access to wireless connection, so that they can download applications for the use of geospatial information services. The costs for purchasing a smartphone and the monthly costs are still relatively high compared to other types of phones. This means that relatively high costs could prevent parts of the population, such as those of rural areas and undeveloped countries, from purchasing smartphones and could lead to an even wider digital divide.
Choi et.al. (2014) showed that the percentage of diffusion of smartphones was 66.2% in 2013 and all cellphone users will have access to wireless connection, so that they can download applications for the use of geospatial information services. The costs for purchasing a smartphone and the monthly costs are still relatively high compared to other types of phones. This means that relatively high costs could prevent parts of the population, such as those of rural areas and undeveloped countries, from purchasing smartphones and could lead to an even wider digital divide.
2.2. Diffusion of broadband access
Another major barrier for the facilitation of any advanced geospatial information services is that citizens need to have access to broadband services in their communities. In fact, most cities in developing and undeveloped countries have a relatively low access rate compared to that of City of Seoul, which means it is relatively inconvenient to access the government geospatial information. According to a recent ranking, Seoul ranks first in the world in terms of broadband diffusion among citizens. Therefore, it is important to ensure affordable broadband access as a fundamental condition for the facilitation of geospatial information service. In other words, ensuring that every citizen has equal access to broadband capability is a pre-requirement for geospatial data and to advance consumer welfare, civic participation, public safety, etc.
2.3. Low use of smartphone applications
In the case of cites in developing countries, even though they may own a cellphone, most citizens are not used to using mobile phone applications on their smartphones. This has to do with the fact that data plans are still very expensive. Moreover, most citizens in those areas have no interest in accessing government geospatial information because they still do not trust online information and prefer offline face-to-face contact when getting information. In this case, geospatial information is not much use to the citizens.
2.4. Digital divide
The diffusion of smartphones or broadband might lead to a digital divide within a certain region. “Digital divide” is defined as the dichotomous form of access to digital information. In other words, digital divide means the difference between citizens who have access and those who do not have access. While many argue that access is a matter of convenience, in many cities in developing countries, access is more than mere convenience. Very few cities have Internet access in public places, such as libraries or community centers. Furthermore, while there are many Internet cafes in Seoul, Internet cafes are rarely available in these other cities. Therefore, all information that is made available for the web or mobile device should be made accessible for those who do not have access to technology.
2.5. Being slow in adopting innovations
In comparison to other private or non-profit sectors, governments tend to be relatively slow in adopting innovations. Especially with regard to innovations such as social media services or other innovative smartphone applications, there is a long internal scrutinizing process necessary to make sure that the new processes are covered by existing rules and regulations within governments. The standards and regulatory policies in terms of utilizing geospatial information exist in government, but do not extend to third party web service. Therefore, it could be a barrier for the provision of geospatial information services and there is a relative disinterest in government agencies and employees to adopt mobile applications or social networking tools to utilize geospatial information.
2.6. Budgetary disincentives
Governments often do not have the incentive to save the budget or spend less. Instead there is an incentive to show that the money budgeted for specific initiatives was spent and that future spending has to be increased. Therefore, existing initiatives by the governments that are already appropriated in the budget are pushed forward and there are no incentives to reassign budget categories and switch to off-the-shelf free third party applications, which can contribute to cheaper geospatial information services.
2.7. Privacy concerns
Along with the barriers mentioned above, privacy concerns are another barrier against the facilitation of GIS. In fact, most citizens are concerned about their personal privacy intrusion by both government and private firms. The lift on the prohibition of online cookies to track user statistics for websites has allowed governments to track information about their users. Mobile phone applications and other websites based on desktop PCs that are providing geospatial information to the public are utilizing private information associated with IP addresses and cellphone numbers of social media accounts to provide a better GIS experience to the citizens.
For example, the Map-Tagging Service and the 3D indoor information of the Seoul Metropolitan Government. When the citizens use the “check-in” function from their mobile devices, the government is actually using private location data from smartphones to provide information about historic locations around the city of Seoul, or provides tips to citizens about the historic background of the location or the museums. Through every check-in, the government tracks not only personal information of each citizen, but also their geographic location.
For example, the Map-Tagging Service and the 3D indoor information of the Seoul Metropolitan Government. When the citizens use the “check-in” function from their mobile devices, the government is actually using private location data from smartphones to provide information about historic locations around the city of Seoul, or provides tips to citizens about the historic background of the location or the museums. Through every check-in, the government tracks not only personal information of each citizen, but also their geographic location.
2.8. Concerns about Big Government
It is evident that in most countries people are concerned about “Big Government.” This has to do with the current political climate in many developing countries. While citizens expect various roles from their governments, they tend to criticize the current Administration for having too much influence and for making too many decisions on behalf of its citizens. This so-called “big government” fear indicates that the government is too large, inefficient, and too involved in the lives of its citizens. Critics of big government are demanding that certain services be assigned to the private sector and that the government only focus on producing public goods. This current political climate should be considered as a barrier for governments to lead in the production, management, and use of geospatial data, but policy decision makers must be aware that without the central role of the government, any GIS project cannot be easily managed.
| # | EIGHT BARRIERS TO THE IMPLEMENTATION OF GIS |
|
|
Diffusion of smartphones in undeveloped and developing countries |
|
|
Diffusion of broadband access |
|
|
Low use of smartphone applications |
|
|
Digital divide |
|
|
Being slow in adopting innovations |
|
|
Budgetary disincentives |
|
|
Privacy concerns |
|
|
Concerns about Big Government |
첨부파일
첨부파일: