The Land Readjustment Program
Definition & Background
The Land Readjustment Program is a replotting-based approach, exchanging and subdividing/combining the land without altering the relationship of rights in existence prior to the program. This method of securing land for public facilities and developing built-up areas in the city was adopted as a way to prevent disorderly urban sprawl as the city grew in areas without sufficient financing. It also sought to acquire public land in new built- up areas in advance. One the advantages of the program is that public land can be acquired without investing public resources as the land owner is compensated through replotting as per a certain percentage of lots on the land set out for public use or for other plans. Priority to become the program entity (and implement the program) is given to the land owner and the association. If this does not occur, the national government, local governments, the Korea Housing Corporation, or the Korea Land Development Corporation can implement it
History
Prior to the 1960s: the “Joseon Town Planning Ordinance” for Residential Areas
The Land Readjustment Program began with the Joseon Town Planning Ordinance in June 1934 while Korea was still under Japanese colonial rule. In February 1937, Seoul chose Donam and Yeongdeungpo districts as the first areas and Daehyeon as the second. The program was implemented in 10 districts spanning over 16,952,000 m² between 1937 and 1945. In the 1950s, the program was implemented in Central District 1 and 2 (1,202,000 m²) as a post-war restoration project.
The 1960s & 1970s: Advancement of the Land Readjustment Program
In Seoul, the Land Readjustment Program reached its peak in the 1960s and 1970s. In the 1960s, the program expanded to include 20 districts (63,674,000 m²) for both 5-Year Economic Development plans and develop- ment of new built-up areas. In the 1970s, the program was implemented in 14 districts (49,650,000 m²). If housing site development1 prior to 1962 was conducted on the premise that detached houses would be built pursuant to the Joseon Town Planning Ordinance, the site development programs that followed were done as part of the Land Readjustment and the Residential Site Development programs, thanks to relevant laws and institutional framework such as the Urban Planning Act and the Land Expropriation Act of 1962. During this period, residential areas occupied by detached houses – such as 100,000 Hwagok Complex of (1965)
– were developed sporadically, while some large apartment complexes – Mapo Apartment (1961) and Civil Servant Apartment (1966, Hangang Apartment) in Dongbu, Ichon-dong – were also developed as part of the government’s pilot program.
In the 1960s, the government also announced a policy to supply housing (mostly apartments) to enhance the efficient use of land in large city areas. In the 1970s, Hangang Mansion (1970, LH apartment), Yeouido Pilot Apartment (1970, City of Seoul), and other apartment complexes built by the public sector for the mid- dle class became immensely popular, further encouraging similar policies to follow. In 1972, the Housing Construction Promotion Act2 and the Act on Temporary Measures for Development Promotion in Specific Areas3 were passed to assist with construction of private housing and to involve private housing construction companies in the Gangnam area in development of Seoul, respectively. These two Acts4 accelerated private
In the 1960s, the government also announced a policy to supply housing (mostly apartments) to enhance the efficient use of land in large city areas. In the 1970s, Hangang Mansion (1970, LH apartment), Yeouido Pilot Apartment (1970, City of Seoul), and other apartment complexes built by the public sector for the mid- dle class became immensely popular, further encouraging similar policies to follow. In 1972, the Housing Construction Promotion Act2 and the Act on Temporary Measures for Development Promotion in Specific Areas3 were passed to assist with construction of private housing and to involve private housing construction companies in the Gangnam area in development of Seoul, respectively. These two Acts4 accelerated private
Development of apartment complexes in and around Yeongdong.
Most of the housing site development around this time was based on the Land Readjustment Program Act. This Act was modified to allow for development of apartment complexes in detached housing areas. In December 1975, the Land Readjustment Program Act was revised to designate group sites to secure land for apartment construction. In January 1976, the “Apartment District System” was introduced to allow the addition of districts for apartment construction on top of the ones specified in the Urban Planning Act, to require developers to build apartment complexes.5 With this change, most residential areas began to see apartments rise, mostly centered in the Gangnam area. This development of Gangnam fueled speculation in the property market. Accordingly, the need for more housing sites and housing grew. By December 1977, the Housing Construction Promotion Act had been completely revised, providing a legal basis for housing site development. In 1979, rules on housing construction were set forth to regulate installation of facilities within the residential complex. This subordinate law was put in place to control the quality and level of facilities in complexes built by private developers.
1980s: Reduction of the Land Readjustment Program
In the 1980s, speculation began to create serious problems in terms of housing affordability. Replaced by a new public development plan, the Land Readjustment Program was only conducted on a limited scope in 5 districts (14,541,000 m²), including Gangdong, Gaepo, Garak and Yangjae.<Figure 1> Characteristics of the Land Readjustment Program by Period
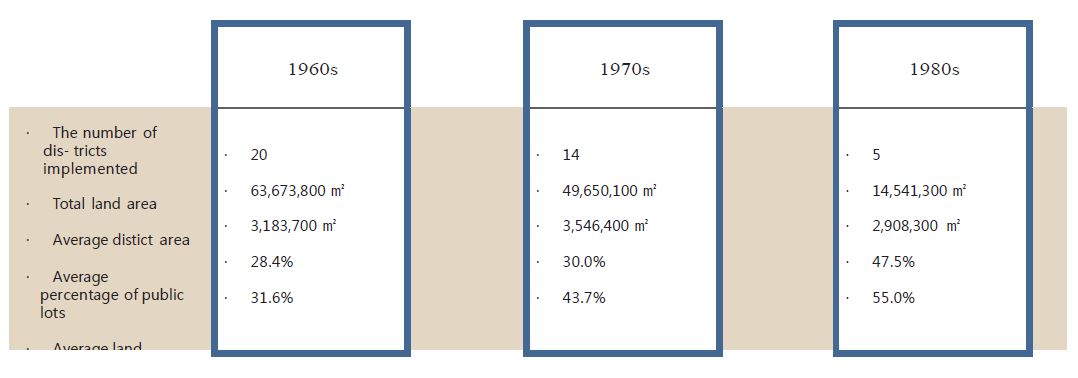
The number of districts (and total land area) where the program was implemented was highest during the 1960s, but average district area was the largest in the 1970s. In the 1980s, the number of programs was re- duced, but the average percentage of public lots and the average land reduction rate were much higher than in previous decades. The increasing size of public land over time can be explained by the fact that the program entities allowed more land for infrastructure, such as roads, parks, waterworks and sewer lines.
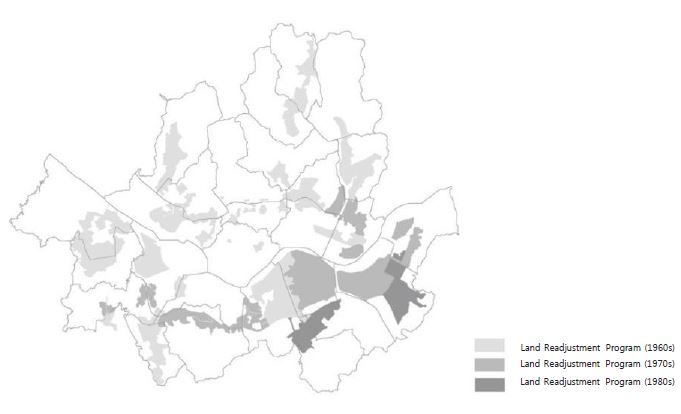
<Figure 2> Land Readjustment Program Districts in Seoul by Period
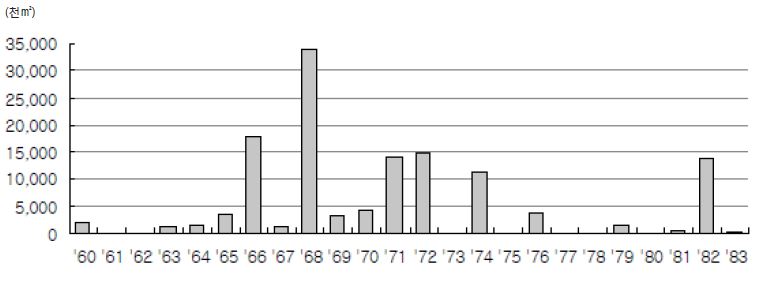
Changes in the Size of Districts in the Land Readjustment Program by Year
By decade, the average district area of the Land Readjustment Program was 3,183,700 m² in the 1960s, 3,546,400 m² in the 1970s, and 2,908,300 m² in the 1980s. The larger areas were preferred as larger facilities boosted the economy and reduced program costs. However, the increasing amount of land to be readjusted and of the rights holders created an issue with replotting and resulted in longer construction periods.
Figure 3 - Size of Districts in the Land Readjustment Program by Year (Approved Programs)
<Table 1> The Land Readjustment Program in Seoul
| District Name |
Date Des- ignated |
Date Ap- proved |
Area (1,000 ㎡) |
Percent- age of Public Lots (%) |
Land Reduction Rate (%) |
Program Cost (KRW 1 million) |
Remarks |
|
| 1960s |
Seogyo | ‘57.7.8 | ‘60.7.13 | 1,723.00 | 30.5 | 25.7 | 224 | City of Seoul |
| Dongdaemun | ‘60.2.8 | ‘60.9.29 | 267.1 | 32 | 30 | 52.3 | City of Seoul | |
| Myeonok | ‘62.3.5 | ‘63.2.5 | 1,101.50 | 24.4 | 29.1 | 170 | City of Seoul | |
| Suyu | ‘61.1.11 | ‘64.10.16 | 1,393.90 | 26.7 | 24.9 | 200 | City of Seoul | |
| Bulgwang | ‘61.1.11 | ‘65.10.7 | 1,189.80 | 28.3 | 24.8 | 185 | City of Seoul | |
| Seongsan | ‘63.3.8 | ‘65.11.8 | 2,246.10 | 29.2 | 33.8 | 340 | City of Seoul | |
| Dokdo | ‘61.1.11 | ‘66.1.21 | 1,354.00 | 25.3 | 25.6 | 275 | City of Seoul | |
| Yeonhee | ‘66.5.26 | ‘66.1.21 | 806.1 | 23.1 | 34.2 | 263 | City of Seoul | |
| Changdong | ‘66.7.1 | ‘66.1.21 | 2,793.10 | 26.3 | 30.2 | 556.3 | City of Seoul | |
| Yeokchon | ‘66.7.1 | ‘66.1.21 | 4,344.50 | 35.2 | 34.4 | 911 | City of Seoul | |
| Hwayang | ‘66.5.10 | ‘66.1.21 | 2,110.50 | 20.7 | 26.6 | 273 | City of Seoul | |
| Mangwu | ‘66.5.10 | ‘66.1.21 | 6,450.60 | 29.2 | 30.6 | 1,340.00 | City of Seoul | |
| Hwagok |
‘66.11.24 |
‘67.3.10 |
1,025.10 |
28.1 |
32.2 |
858.7 |
Korea Housing Corporation |
|
| Gyeongin | ‘66.12.28 | ‘68.1.8 | 6,918.70 | 27.4 | 32.9 | 1,723.00 | City of Seoul | |
| Yeongdong 1 | ‘66.12.28 | ‘68.1.8 | 12,737.80 | 41.8 | 39.1 | 4,725.00 | City of Seoul | |
| Gimpo | ‘66.12.28 | ‘68.1.23 | 4,706.40 | 27.3 | 31 | 1,274.80 | City of Seoul | |
| Siheung | ‘66.12.28 | ‘68.1.23 | 5,746.20 | 26.3 | 30.8 | 1,249.00 | City of Seoul | |
| Dobong | ‘66.12.28 | ‘68.1.23 | 2,661.60 | 32.9 | 36.3 | 521.3 | City of Seoul | |
| Gaebong 1 |
‘68.5.14 |
‘68.7.18 |
959.7 |
28.8 |
44.4 |
968.5 |
Korea Housing Corporation |
|
| Junggok | ‘67.8.10 | ‘69.10.1 | 3,138.10 | 23.7 | 34.9 | 1,356.70 | Union | |
| Subtotal (20) | 63,673.80 | 28.4 | 31.6 | 17,478.60 | ||||
| 1970s |
Gaebong 2 |
‘70.3.11 |
‘70.5.25 |
1,030.80 |
28.3 |
55.1 |
1,275.30 |
Korea Housing Corporation |
| Shillim | ‘66.12.28 | ‘70.9.3 | 3,420.00 | 33 | 33.1 | 1,447.00 | City of Seoul | |
| Yeongdong 2 | ‘66.12.28 | ‘71.8.24 | 13,071.90 | 27.2 | 36.8 | 10,683.00 | City of Seoul | |
| Jamsil | ‘71.5.5 | ‘74.12.6 | 11,223.20 | 41 | 52.9 | 10,100.00 | City of Seoul | |
| Yeongdong 1 (additional) | ‘71.5.5 |
‘71.12.28 |
991.7 |
31.8 |
39.8 |
983.2 |
City of Seoul |
|
| Hwayang (additional) |
‘71.11.26 |
‘72.3.28 |
1,522.40 |
29.4 |
38.5 |
617 |
City of Seoul |
|
| Cheonho | ‘66.12.28 | ‘72.11.6 | 2,621.60 | 27.3 | 35.1 | 4,000.00 | City of Seoul | |
| Shillim (addi- tional) | ‘71.5.5 |
‘72.11.6 |
2,006.60 |
29.5 |
32.8 |
1,400.00 |
City of Seoul |
|
| Yeongdong 2 (additional) | ‘71.11.26 |
‘75.2.14 |
85.4 |
21.9 |
39.5 |
92.6 |
City of Seoul |
|
| Heungnam | ‘71.3.10 | ‘72.2.9 | 556.4 | 22.7 | 50.1 | 577 | Union | |
| Isu | ‘71.4.8 | ‘72.2.18 | 8,028.30 | 23.2 | 39.4 | 3,159.20 | Union | |
| Amsa | ‘75.1.18 | ‘76.4.22 | 1,697.10 | 29.4 | 50.4 | 3,400.00 | City of Seoul | |
| Janganpyeong | ‘75.1.18 | ‘76.6.25 | 1,933.10 | 33.6 | 53.8 | 5,944.30 | City of Seoul | |
| Guro | ‘77.1.31 | ‘79.3.29 | 1,461.60 | 41.4 | 54.4 | 18,650.00 | City of Seoul | |
| Subtotal (14) | 49,650.10 | 30 | 43.7 | 62,328.60 | ||||
| 1980s |
Isu (additional) | ‘79.9.21 | ‘81.4.10 | 76.6 | 42.7 | 53.3 | 6,937.20 | Union |
| Gangdong | ‘80.5.20 | ‘81.4.10 | 363.6 | 40.6 | 53 | 4,600.00 | City of Seoul | |
| Gaepo | ‘81.4.11 | ‘82.2.18 | 6,491.30 | 62.1 | 5734 | 128,229.00 | City of Seoul | |
| Garak | ‘80.7.2 | ‘82.3.20 | 7,455.10 | 60.7 | 68.3 | 112,995.00 | City of Seoul | |
| Yangjae | ‘83.3.11 | ‘83.11.22 | 154.7 | 31.3 | 43.1 | 5,147.30 | City of Seoul | |
| Subtotal (5) | 14,541.30 | 47.5 | 55 | 257,908.50 | ||||
| Total | 127,865.20 | 31.4 | 38.9 | 337,715.70 |
Limitations & Development
Because the Land Readjustment Program usually supplied sites for detached housing, it did not alleviate the housing shortage caused by rapid urbanization at the time. There was a growing need for extensive sites for housing to respond to the population boom, with a strong institutional framework to control land develop- ment as there was a problem of privatizing development profits. In response to these needs, the Housing Site Development Promotion Act was passed in December 1980, under which the public sector was able to take a leading role throughout the stages of acquiring, developing, supplying and managing the housing sites. In January 2000, various urban plans and development programs regulated by the Urban Planning Act were integrated into the Urban Development Act, and the Land Readjustment Program also changed to urban planning through replotting.
Achievements & Challenges
The Land Readjustment Program was an approach suitable to built-up area development when financing was insufficient in the early days. Nearly half of the already-developed area was developed to supply land and lots for public use and accommodate the waves of people moving into the city. By the end of the 1960s, the program was implemented all over Gangnam, dispersing the population away from Gangbuk.
Deterioration of Detached Housing & Growing Demand for Reconstruction
The Land Readjustment Program offered replotting as compensation, which pushed up the percentage of detached houses and created a problem of development profit privatization. Moreover, real estate prices grew in the process of selling replotted land, with demand increasing for lots for public use. By the end of the 1980s, the program transitioned into the Housing Site Development Program based on public development. Currently, all Land Readjustment Program districts, including the Yangjae district, (the last program, designat- ed in 1983), are 20 years old and older. The land remains low-rise and low-density due to the program, and thus demands for reconstruction are steadily rising.
The introduction of new types of housing – multi-household and multi-unit buildings in 1984 and 1990 – quickly multiplied the number of households in the Land Readjustment Program areas. Most areas however lacked parking lots and other infrastructure along with narrow alleys ways. The demands for systematic man- agement plans increased.
Note: Class 3 General Residential Area is similar to Class 1 and 2 in allowed use, but differs in floor area.
Source: Urban Planning Ordinance of Seoul, Chapter 8, Section 1.
<Table 3> Changes to the Residential-Commercial Building System
Source: Article 32, Enforcement Decree, the Housing Construction Promotion Act, Article 4, Rules on Housing Construction Stan-
dards, Attachment 2, Urban Planning Ordinance of Seoul.
Lack of Infrastructure
The introduction of new types of housing – multi-household and multi-unit buildings in 1984 and 1990 – quickly multiplied the number of households in the Land Readjustment Program areas. Most areas however lacked parking lots and other infrastructure along with narrow alleys ways. The demands for systematic man- agement plans increased.
Mixed Use
In many regions, community facilities were set up in residential areas, giving rise to a mixing of commercial facilities and detached houses. The increasing number of community facilities within the general residential areas complicates the categorization necessary for urban planning and degrades the living environment, making it necessary to review the facilities being allowed for commercial use.
<Table 2> Use of Community Facilities in Residential Areas
| Category | Allowed Use | Remarks |
| Class 1 Gener- al Residential Area |
Class 2 Community Facilities (Excluding bars and massage parlors) Religious assembly facilities, charnel house (in the religious assembly facilities), zoo or botanic garden (cultural assembly), educational facilities, research facilities, youth hostel (training facilities), exercise facilities, parking lot |
Enforcement Decree of the Construc- tion ActRefer to Attachment 1 · 4. |
| Class 2 Gener- al Residential Area |
Class 2 Community Facilities (Excluding bars and massage parlors) Performance hall, assembly hall, retail shops, medical clinic, broadcasting and communications facilities, generator facilities, education, research facilities, public service facilities from busi- ness facilities, financial business branch/office, storage, parking lot, carwash, generator facilities, military facilities, storage and treatment of dangerous materials (petrol station, pressurized gas charging station and storage) |
Enforcement Decree of the Construc- tion Act Refer to Attachment 1 · 5. |
| Class 3 Gener- al Residential Area |
Class 2 Community Facilities (Excluding bars and massage parlors) Performance hall, assembly hall, retail shops, medical clinic, broadcasting and communications facilities, generator facilities, education, research facilities, business facilities, exercise facil- ities, training facilities, storage, factory, parking lot, carwash, generator facilities, military facilities, prison, storage and treat- ment of dangerous materials (petrol station, pressurized gas charging station and storage) |
Enforcement Decree of the Construc- tion Act Refer to Attachment 1 · 6. |
Source: Urban Planning Ordinance of Seoul, Chapter 8, Section 1.
Increase of Residential-Commercial Buildings
Residential-commercial buildings were built in concentration in the central commercial areas, such as at area or district centers, resulting in a shortage of business facilities and other facilities. This was because since 1994, residential facilities in residential-commercial buildings were easily excluded from the requirement for plan approval when certain conditions were met, and regulations on residential-commercial buildings located in the commercial areas were steadily eased. From 1999, large houses of less than 297㎡ were allowed and construction was permitted for up to 90% of the total area.
<Table 3> Changes to the Residential-Commercial Building System
| Residential Facilities Excluded from Requirement for Plan Approval | Facilities Allowed to be Built in Multi-unit Residential Buildings | Allowed Floor Space Ratio |
|
| 1982.5 |
- | · Community facilities, busi- ness facilities, sale facilities | - |
| 1989.9 |
- |
· Community facilities, busi- ness facilities, sale facilities, social welfare center | - |
| 1994.7 |
· Average net area: up to 150 m² · Less than 50% of total area · Less than 200 households |
· Same as above |
- |
| 1995.1 |
· Average net area: up to 150 m² · Less than 70% of total area |
· Same as above |
- |
| 1998.4 |
· Average net area: up to 150 m² · Less than 90% of total area |
· Same as above |
- |
| 1999.12 |
· Maximum net area: less than 297 m² · Less than 90% of total area |
· Same as above | - |
| 2000.7 |
· Same as above |
· Same as above | · Central commerce: 800%/1,000% · General commerce: 600%/800% · Community commerce: 600% |
Source: Article 32, Enforcement Decree, the Housing Construction Promotion Act, Article 4, Rules on Housing Construction Stan-
dards, Attachment 2, Urban Planning Ordinance of Seoul.
Shortage of Public Lots & Reduction of Lot Size
To pay for the program and secure public lots without financial assistance, lot size reduction6 inevitably in- creased. The average percentage of public lots also gradually decreased: 28.4% in the 1960s, 30.0% in the 1970s, and 47.5% in the 1980s. Lot size reduction increased accordingly to 31.6%, 43.7%, and 55.0% for the respective decades. Due to the resistance of landowners and the percentage of public lots decreased in many districts, which led to deteriorating quality in terms of space.
Case: Gaepo District 3
Outline
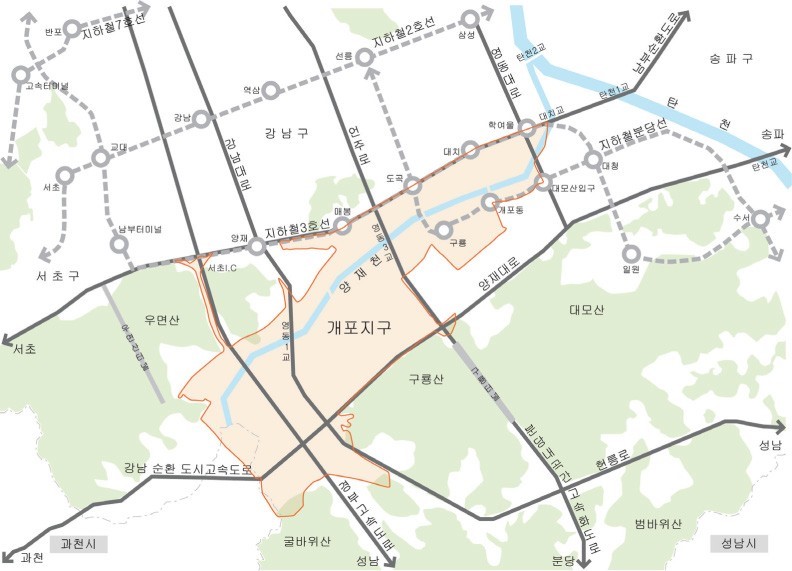
Gaepo District is located 13 km to the southeast of the city center. It once belonged to Gwangju-gun, Gyeo- nggi Province but was absorbed by Gangnam-gu, Seoul after adjustment of the administrative districts. It spans across Daechi-1-dong, Daechi-2-dong, Gaepo-4-dong, Dogok-2-dong (Gangnam-gu) and Yangjae-2-dong (Seocho-gu) and is easily accessible via Subway Line 3 and the new Bundang Line.
<Figure 4> Gaepo District Surroundings
Designation of the Land Readjustment Program Districts
Gaepo District was originally designated as part of the Land Readjustment Program by the City of Seoul in January 1968 and some of it was replotted. However, the program was canceled due to the Green Preserva- tion Plan in June 1978. In April 1981, the Ministry of Construction designated the district while implementing the Land Readjustment Program Act. The site development program in Gaepo District aimed to supply exten- sive sites to build 5 million houses, the plan for which was launched to address the housing shortage issues in the early 1980s pursuant to the Housing Construction Promotion Act.
To alleviate the lack of sufficient urban infrastructure and traffic congestion in Seoul, the government sought to disperse the population away from the Seoul metropolitan area and contain growth in the CBD. It focused on developing Gangnam so as to divert the urban functions from Gangbuk to Gangnam. Gaepo was then planned as the next new “downtown” for Seoul. By developing this district, Seoul attempted to address the housing shortage and promote balanced urban development.
<Table 4> Gaepo District Development History
| Detail | Remarks | |
| Dec. 1980 | · Change in intended use of part of Yangjae District and application for Land Readjustment Program plan |
|
| Jan. 1981 | · Change in intended use of part of Yangjae District and cancellation of applica- tion for Land Readjustment Program plan | |
| Apr. 1981 | · Gaepo District designated for housing site development | · Notice #113 of the Minis- try of Construction |
| Jul. 1981 | · Basic Urban Development Plan established for Gaepo District | |
| Sep. 1981 |
· Notification of changes to the site development plan for Gaepo District |
· 8,460,000 m² (2,559,000 pyeong) |
| Nov. 1981 | · Approval of the site development plan for Gaepo District | |
| Feb. 1982 |
· Changes to the Gaepo District 3 development plan and approval for action plan · Implemented as part of the Land Readjustment Program |
· Notice #76 of the Ministry of Construction · 6,618,000 m² (2,002,000 pyeong) |
| Mar. 1982 | · Public notice of replotting plans for the Land Readjustment Program district in Gaepo | |
| Sep. 1983 | · Approval for development plan changes and action plan for Gaepo District 3 | · Notice #296 of the Minis- try of Construction |
| Sep. 1983 | · Approval for replotting plan and designation of planned replotting area | · Notice #534 of the City of Seoul |
| Jun. 1985 | · Approval for changes to development plan and action plan | · Notice #25 of the Ministry of Construction |
| Feb. 1987 | · Approval for changes to replotting plan and designation of planned replotting area | · Notice #116 of the City of Seoul |
| Dec. 1988 | · Construction completed and replotting plan changed / Notification of replot- ting confirmation | · Notice #992 of the City of Seoul |
| 2002 | · District unit plan established for Gaepo area in Gangnam-gu | · Multi-unit housing area |
| 2004 | · District unit plan established for Yangjae area in Seocho-gu |
Implementation of the Land Readjustment Program
While designating districts for site development, the Ministry of Construction divided Gaepo District into 3 areas, with one area each to be developed by the City of Seoul (5,983,000 m²), the Korea Land Corporation (1,818,000 m²), and the Korea Housing Corporation (602,000 m²). In 1981, land to be developed in all 3 dis- tricts was to be expropriated, but this changed due to the Land Readjustment Program in February 1982. Gaepo District 1 and Gaepo District 2 were thus developed as part of the public development approach by the Korea Land Corporation and the Korea Housing Corporation, while Gaepo District 3 was developed by the City of Seoul based on the Land Readjustment Program. Seoul divided Gaepo District 3 into 2 areas: the east was for multi-unit houses, while the Yangjae area in Seocho-gu and other parts were developed as partof the Land Readjustment Program.
After construction was completed, an issue was raised on the Land Readjustment Program in Gaepo District 3. It was the only place in the site development program area where the land was replotted as per the land readjustment method, which was in violation of the Housing Site Development Promotion Act. In site devel- opment program districts, land readjustment was only allowed on “confirmed areas targeted by the Land Readjustment Program” and “areas where land prices are higher than in designated districts in the vicinity, making it impossible to develop the site otherwise”. Neither of these criteria applied to Gaepo.
<Table 5> Changes in the Gaepo District (Unit: 10,000 m²)
| Period | Gaepo District 1 (Korea Land Corpo- ration) | Gaepo District 2 (Korea Housing Corporation) | Gaepo District 3 (City of Seoul) | Total |
| Apr. 1981 | 181.8 | 60.2 | 598.3 | 840.3 |
| Sep. 1981 | 213.2 | 33.1 | 599.7 | 846.0 |
| Nov. 1981 | 213.2 | 35.0 | 675.6 | 923.8 |
| Feb. 1982 | 213.7 | 35.0 | 661.8 | 910.5 |
| Sep. 1983 | 213.7 | 35.0 | 645.1 | 893.8 |
| Feb. 1987 | 213.7 | 35.0 | 649.4 | 898.1 |
Basic Features of the Site Development Plan for Gaepo
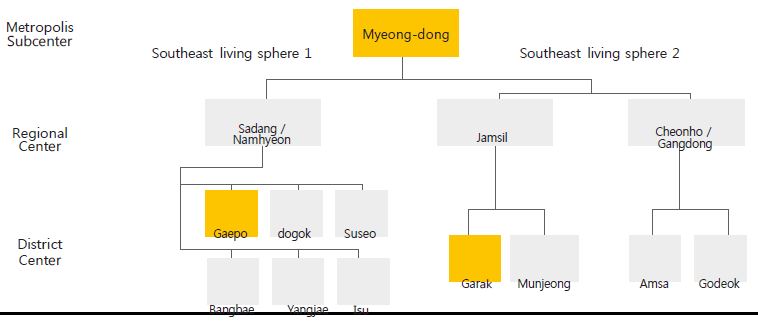
The purpose of the plans for Gaepo District 3 was to create idyllic residential areas and an advanced streets- cape, allow for development to meet cultural and consumer needs, and enable private development by pro- viding public programs and infrastructure. Based on the neighborhood unit theory, a “daily living sphere” was formed, which was hierarchically structured to complete the total spatial structure. The total spatial structure was made up of 4 stages – local center, district center, neighborhood center, and neighborhood precinct.
<Figure 5> Structure of the Basic Seoul Urban Plan 2020
Gaepo District 3 was an early Korean model of the neighborhood unit theory. It was a relatively strict concept
of household unit complex, but some parts were more street-oriented.
of household unit complex, but some parts were more street-oriented.
Evaluation
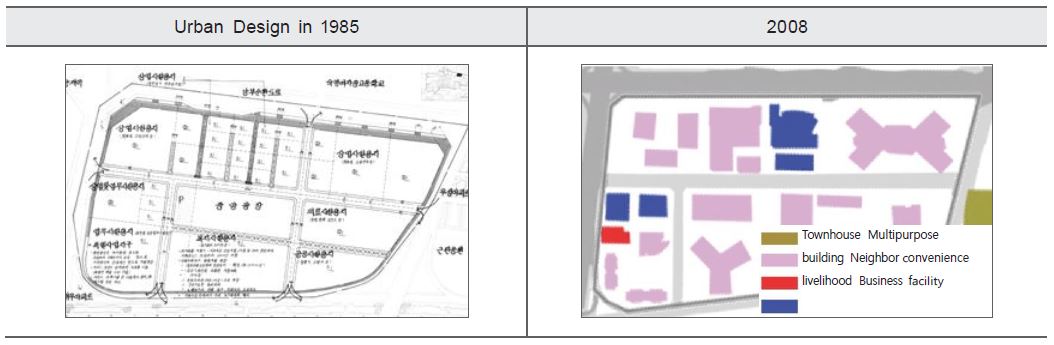
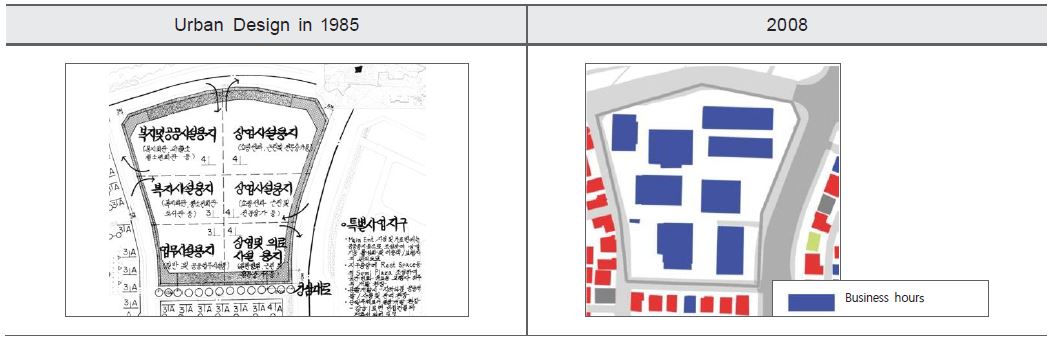
Characteristics of the Plan: Separation of Detached Housing & Multi-Unit Dwelling Areas
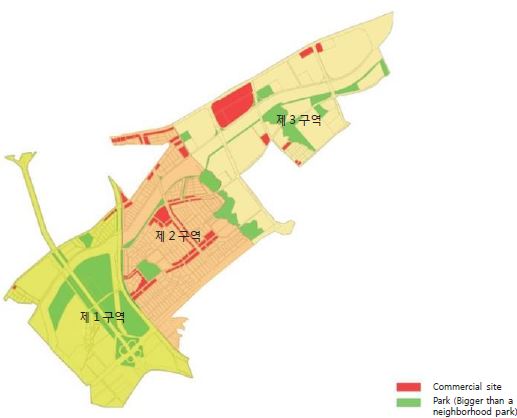
Gaepo District 3 was divided into 3 districts: District 1 with large parks, detached housing and a commercial distribution area near the highway; District 2 with detached housing only; and District 3 with multi-unit dwell- ings. District 2 saw the most change of the 3 parts.
<Figure 6> Urban Design by District in Gaepo District 3 (1985)
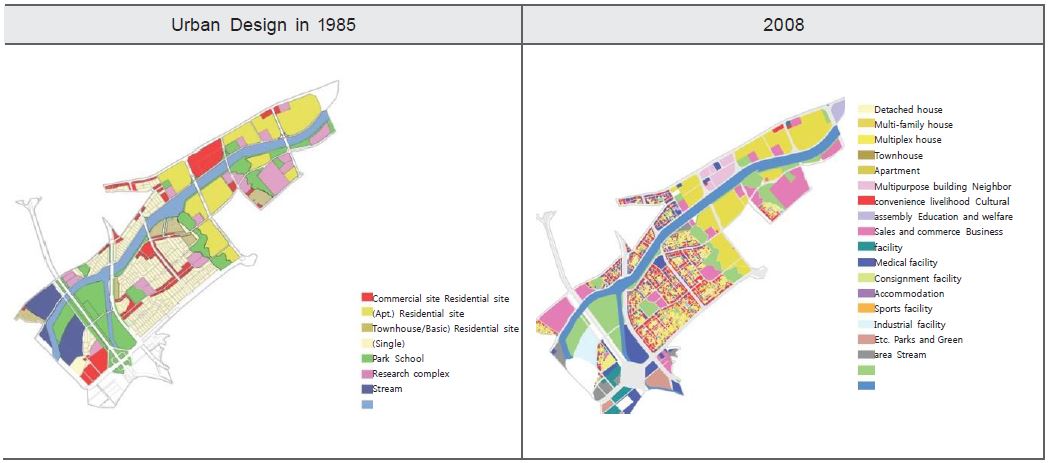
Detached Housing Area: Transition to Multi-Household/Unit Dwellings & Increased Community Facil- ities
Detached housing in the area was mostly changed to multi-household/unit dwellings and the number of community facilities increased, weakening the residential function of the area but strengthening its commer- cial functions. Of the existing units, 17.5% are 20 years or older while 66.1% are 10 to 20 years old. There is no concentration of deteriorating houses that are 20 years old or more because most were changed to multi-household/unit dwellings. For the same reason, the unit density of the detached housing area is high, standing at 197 households/ha. However, the sections adjacent to roads measuring 6m or longer are quite good at 70%, with no lot smaller than 90 m². The parking issue is serious however, with about 0.49 spaces per household.
<Table 6> Changes to Land Use in Gaepo District 3
<Table 7> Land Use in Gaepo District 3
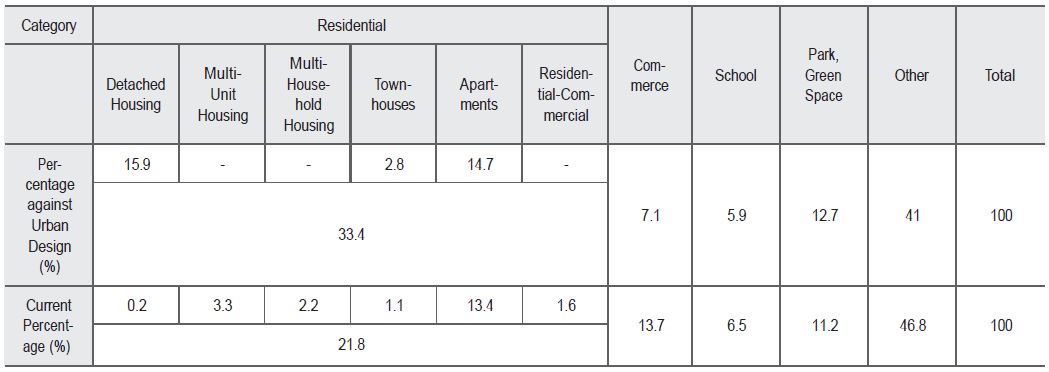
Note: The current percentages are based on site investigation and GIS analysis.
Multi-Unit Dwellings: All 20 Years or Older
Large and medium complexes are the most numerous, with 37.4% of complexes housing between 300 and 1,000 households, and 24.9% housing more than 1,000. There are 18 complexes; all but one are 20 years old or more. By size of housing unit, those up to 60 m², between 60 & 85 m², and larger than 85 m² account for 21.6%, 21.4%, and 57.0% respectively, with some 80% being designated as “medium to large”. In terms of the floor space ratio, 72.2% of the 18 complexes are 200% or less; density is relatively low due to the buildings’ linear arrangement as well as the distance between buildings. Household density is 150/ha in 10 buildings, in 55.5% of the total. The available parking spaces per household equal 1 or more, but actual inves- tigation revealed that 90% of the complaints were about parking.
<Table 8> Changes in Residential Type in Gaepo District 3
| Residential Type (2008) |
Detached | Multi-unit/ household |
Townhouse | Apartment | Total | |
| Area Percent- age |
Detached House |
2.9 | 72.9 | 16.6 | 7.6 | 100.0 |
| Townhouse | 1.9 | 79.7 | 14.5 | 3.9 | 100.0 | |
Commercial Center: Dominant Residential-Commercial Buildings
To ensure the self-sufficiency of Gaepo District 3, the following areas were designated as commercial areas: 1 local center; 2 district centers; and 7 neighborhood centers. The Asian financial crisis however encouraged the construction of residential-commercial buildings, which take up the largest area (50.7%) in the commer- cial area.
<Table 9> Changes in Local Centers in Gaepo District 3
<Table 10> Changes in District Centers in Gaepo District 3
<Table 11> Changes in Neighborhood Centers in Gaepo District 3
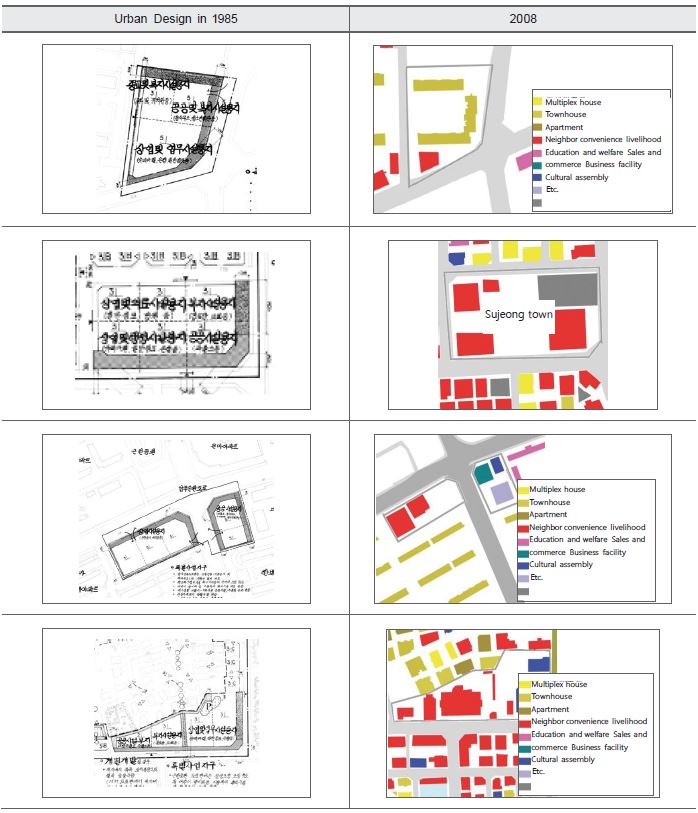
Currently, the local centers are mainly occupied by residential-commercial buildings such as Tower Palace.
The neighborhood centers were originally designed to be the center of the living sphere and to accommodate commercial facilities and amenities, but today, only 4 neighborhood centers have a gu-district community center, commercial facilities, post office and the like. In the other 3 neighborhood centers are business facil- ities, an unauthorized slum area (Sujeong Village), and apartments, altering the originally intended function since sale of the area was more time consuming than expected. As for local centers, 37.4% were sold 7 years after initially offered, with 83.8% sold today.
Transportation: Controlled Traffic on Nearby Arterial Roads
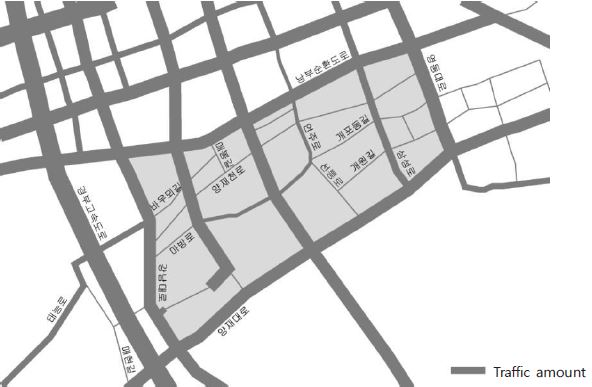
Created by the Land Readjustment Program, Gaepo District 3 has a regularly planned landscape, mobility (ex- cept for pedestrian mobility), accessibility, flexibility to growth and change, and an excellent grid road network that can adjust to overpopulation or concentration. Traffic is concentrated on the major arterial roads such as Gangnam Avenue and Yangjae Avenue, Eonju-ro connected to Seongsu Bridge, and the Nambu Beltway con- necting east and west. On most main roads, traffic volume exceeds capacity at peak hours, at a congestion rate of higher than 1.0. Travel on the main roads in Gangnam-gu is significantly slower in the afternoon than in the morning because of the concentration of large business and commercial facilities around Gangnam Ave- nue and Tehran-ro where traffic volume grows in the afternoon. The total number of people in Gangnam-gu is decreasing, but the number of registered vehicles in Gaepo District 3 grew from 29,000 in 2006 to 42,000 in 2012 and is expected to grow further. Even in Gangnam, Gaepo District 3 has the highest traffic density, and the redevelopment and reconstruction programs will further increase traffic volumes
<Figure 7> Road Network & Traffic Volume in Gaepo District 3
Summary
The Land Readjustment Program was carried out by an association of land owners and sites supplied for detached houses via replotting-based compensation. However, the program did not improve the housing shortage much, and replotting came with undesired side effects, such as privatization of development profits and rising land prices. Demand for multi-unit dwelling sites continued to grow, and the Land Readjustment Program had to come to an end in the late 1980s. Since passage of the Housing Site Development Promotion Act in December 1980, the public sector was actively involved throughout each stage of acquisition, develop- ment, supply and management of the sites.
The Land Readjustment Program, devised to respond to rapid urbanization in the 1980s, was designed to supply the required sites while minimizing the financial burden on the public sector. In program districts that are 20 years old or more, there is a need for remodeling, reconstruction and other types of improvement. The Program does have some historical significance in Seoul’s urban plans of the past. It will be necessary to con- duct a comprehensive evaluation in terms of the functions and roles of a large-scale development program from the point of view urban planning and socioeconomics before improvement programs are implemented in earnest.
The Land Readjustment Program, devised to respond to rapid urbanization in the 1980s, was designed to supply the required sites while minimizing the financial burden on the public sector. In program districts that are 20 years old or more, there is a need for remodeling, reconstruction and other types of improvement. The Program does have some historical significance in Seoul’s urban plans of the past. It will be necessary to con- duct a comprehensive evaluation in terms of the functions and roles of a large-scale development program from the point of view urban planning and socioeconomics before improvement programs are implemented in earnest.
Table 12 - Comparison: Land Readjustment Program, Urban Development Program & Site Development Program
| Category |
Land Readjustment Program (Urban Development Based on Replotting) | Site Development Program |
Urban Development Program |
| Purpose |
Enhance the efficiency of land use. Improve public facilities. |
Resolve urgent housing short- ages. |
Develop a city that serves com- posite functions |
| Legal Basis | Land Readjustment Program Act | Housing Site Development Promotion Act |
Urban Development Act |
| Program District |
Land Readjustment Program Districts |
Site Development Program Sites | Urban Development Sites |
| Program Entity |
Association of landowners Central/local government Korea Housing Corporation Korea Land Corporation |
Central government, local gov- ernment organizations Korea Land Corporation Korea Housing Corporation Local public corporations and private-public partnerships |
Central government, local gov- ernment organizations Joint ventures Landowners or landowner asso- ciations |
| Method | Replotting | Full purchase | Full purchase, replotting, or both |
| Land Supply | Replot after reducing lot size | Supply to construction compa- nies at cost or less | Dependent on program method |
| Financing |
By landowner | By program entity | By indirect government assis- tance By program entity |
| Infrastructure | Unclear as to who is responsible for construction | Unclear as to who is responsible for construction | Clearly specifies who is responsi- ble for construction |
| Development Profits |
Privatization of development profits | May be returned to society | May be returned to society |
| Development Type |
Low-density, low-rise | High-rise, high-density | High-rise, high-density |
| Advantages |
No burden of investment | Supply of affordable sites Social contribution of develop- ment profits Advantageous for systematic de- velopment and efficient land use |
Development of a city with com- posite functions Private sector participation Percentage of contribution to infrastructure is clearly specified |
| Disadvantages |
Program prolonged due to con- flicts between owners Cause for rising land prices and real estate speculation |
Complaints from original land- owners Excessive financial burden on program entity Increase in money supply to area due to extensive compensation for land → rising land prices in vicinity and more speculation |
Limited number of program sites Difficult for private investors to secure program sites |
References
· Won Dong-il, An Hyeong-sun, Gang Jun-mo, 2005, “Comparative Analysis: Changes in the Land Policies and Site Development Systems of South Korea and China”, Korea Planners Association 2005 Symposium (11. 4~5) Collection p.432.
· The Seoul Institute, 2009, Analysis & Evaluation of the Extensive Development Programs in Seoul.
· Seoul Metropolitan Government, 1990, White Paper on Seoul Land Readjustment.
· Ministry of Land, Infrastructure & Transport, 1974, Enforcement Decree, the Housing Construction Promotion Act.
· Ministry of Land, Infrastructure & Transport, 2012, Rules on Housing Construction Standards.
· Seoul Metropolitan Government, 2014, Attachment 2, Urban Planning Ordinance of Seoul.
· Seoul Metropolitan Government, 2014, Chapter 8, Section 1, Urban Planning Ordinance of Seoul.