废热回收项目
Policy Implementation Period
- 1960~1985: General waste disposed at local landfill sites
- 1978~1993: Waste disposed at Nanji landfill site
- 1986: Mokdong incineration facility operation started
- 1991: Seoul City - Basic Waste Disposal Plan founded
- 1992~2005: 4 resource recovery facilities constructed
- 1993: Waste disposed at capital area landfill site
- 2007~2010: 4 resource recovery facilities - sharing agreed
General Information
In Korea, the economic development of the 1960s prompted the growth of waste disposal as well. Generated waste was used as bank materials at housing sites in the suburban areas. Nanji landfill began operation in 1978, and waste disposal switched to landfill.
Through rapid development, Seoul successfully held the 1986 Asian Games, and 1988 Olympics and was thus becoming an international city. However, internally it was faced with the problems of waste disposal (e.x. Nanji landfill), and waste disposal was becoming a social issue of the time.
To resolve this, Seoul Metropolitan Government (SMG) founded its 'Basic Waste Disposal Plan' in 1991, and planned the construction of major incineration facilities.
The Importance of the Policy
Large cities with a high population density dispose proportionally large volume of waste, and if the city takes care of such amounts on its own, its land cannot be used flexibly. However, if the location of landfill site is far away from the city, the cost for transportation grows considerably.
Incinerating waste within the city area has many benefits. Waste can be disposed in 1 to 2 days, therefore requiring smaller facility capacity. After incineration, the weight and volume of the waste significantly decreases, and incinerated waste does not emit much odor. Even when it is placed at landfill sites, it becomes more efficient in terms of space and management.
Moreover, the heat energy generated during incineration can be used in city areas. Therefore, incineration can be considered an important waste management policy in the cities.
Relevance with Other Policies
Modern waste management policy is composed of three steps: First, the amount of waste is restricted through recycling and reducing the waste itself. Second, waste that had to be generated goes through energy recycling or is recycled as material to be used as a further resource. Finally, waste that cannot be handled by the previous two steps, safe disposal is required – such as through the use of incineration or landfill.
Therefore, predictions should be made for the total amount of waste, the amount of waste that can be recycled, and the amount of waste that should be dealt with through incineration or landfill. Overall, an appropriate balance should be made with these values in mind.
Seoul observed its rapid growth and first considered incineration as the most appropriate method with which to reduce landfill, rather than reducing the total amount of waste. However, the volume-based waste fee (VBWF) system in 1995, the extended producer responsibility (EPR) in 2003 and direct landfill ban of food waste helped reduce the overall amount of waste in general. This aided in the reduced dependence on incineration and landfill.
Policy Objectives and Processes
- Maximize the processed waste in order to minimize the amount of waste disposed at landfill sites.
- Install an appropriate amount of waste disposal facilities to maximize the resource recovery rate.
- Minimize toxic materials in the incineration process and improve safety for local residents.
- Complex coordination with supplementary facilities for local residents to improve welfare.
Main Policy Contents
1) Securing Common Incineration Facilities
There are four incineration sites in Seoul: Yangcheon Facility, Nowon Facility, Gangnam Facility and Mapo Facility. These are all in operation within the city of Seoul (with the capacity of more than 400 tons per day). Plans for these facilities began in 1991.
When the plan was founded in 1991, the design was to build 11 incineration facilities to take care of 16,500 tons per day, but only 4 facilities have since been constructed. The construction started in October 1992. Yangcheon Facility was built in February 1996, Nowon Facility in January 1997. Gangnam Facility followed in December 2011, and Mapo Facility was completed in May 2005.
Yangcheon Facility started its construction in December 1992, and was finally finished in February 1996. It has a capacity of 400 tons, with 2 incinerators that can process 200 tons per day. Nowon Facility also started its construction in December 1992 and finished in January 1997. It has a capacity of 800 tons: 2 incineration units that can process 400 tons per day. Gangnam Facility's construction started in December 1994, and finished in December 2001. Its capacity is 900 tons per day, the largest among all 4 facilities. There are 3 incineration units each of which can process 300 tons per day. The construction of Mapo Facility started in December 2001 and completed in May 2005, whose capacity is 750 tons with three incinerators capable of taking 250 tons per day.
Table 1. Construction of Incineration Facilities in Seoul
| Category | Yangcheon Facility | Nowon Facility | Gangnam Facility | Mapo Facility |
| Capacity | 400 Tons/Day (2 Units) | 800 Tons/Day (2 Units) | 900 Tons/Day (3 Units) | 750 Tons/Day (3 Units) |
| Construction Period | 1992.12~1996.2 | 1992.12~1997.1 | 1994.12~2001.12 | 2001.12~2005.5 |
| Area | 14,627㎡ | 46,307㎡ | 63,813㎡ | 58,435㎡ |
| Construction Cost | 32.1 Billion KRW | 74.3 Billion KRW | 115.5 Billion KRW | 171.2 Billion KRW |
| Incinerator | Stoker Type | Stoker Type | Stoker Type | Stoker Type +Rotary Kiln |
| Air Purification Facility |
Wash Tower Semi Dry Reactor Bag Filter SCR Catalyst Tower |
Electric Precipitator Wet Wash Tower Bag Filter SCR Catalyst Tower |
Wash Tower Semi Dry Reactor Bag Filter SCR Catalyst Tower |
Semi Dry Reactor Bag Filter SCR Catalyst Tower Police Filter |

Figure 1. Mapo Incineration Facility Structure
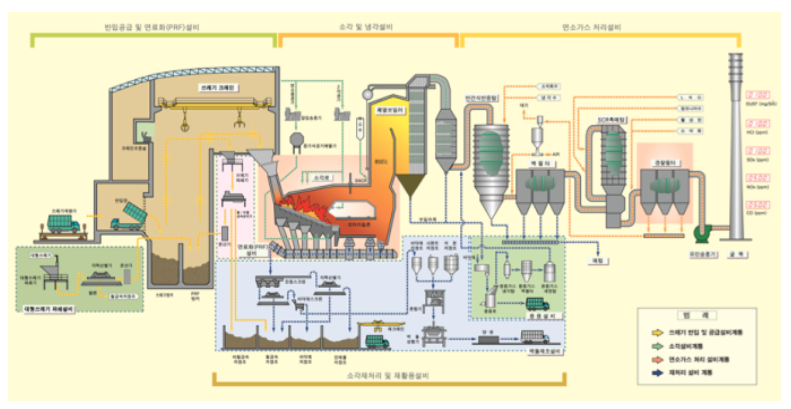
These incineration facilities can process up to 2,850 tons per day. The capacity has been estimated based on the amount of waste disposal at the time they were designed, and the estimated amount for the time afterwards. When comparing of the original 1991 plans (11 facilities, 16,500 tons processed per day) to the actual capacity (4 facilities, 2,850 tons per day), only 36% of the facilities were built and the capacity stood at about only 17%. It seems they will not provide much help for the management of municipal solid waste (MSW) in Seoul. However, various waste reduction policies (i.e. the introduction of VBWS, the expansion of recyclying, food waste into resource) was in place while the facilities were being constructed. In the 2000s, when the 4 facilities started operations, the target amount had been significantly reduced, and therefore the 4 facilities could cover more MSW in Seoul. Yangcheon Facility, for example, was designed expecting about 400 tons of waste from Yangcheongu. But the district only generated 212 tons in 2002, 101 tons in 2012: 53% and 25% of the capacity, respectively. The Nowon Facility also processed about 25% (2002) and 15% (2012) of their capacity, and there was 33-34% recorded for the Gangnam Facility. Mapo Facility had been designed to process MSW of Mapogu, Junggu and Yongsangu whose capacity is 750 tons per day. However, the amount of MSW generated in the three local districts was only about 60% of their capacity in 2012.
Table 2. Capacity of Incinerator facilities in Seoul and Actual Volume of MSW
| Facility | Assigned Area at Design Phase | Capacity (Ton/Day) |
MSW in 2002 (Ton/Day) |
MSW in 2012 (Ton/Day) |
| Yangcheon Facility | Yangcheongu | 400(1.00) | 212(0.53) | 101(0.25) |
| Nowon Facility | Nowongu | 800(1.00) | 201(0.25) | 121(0.15) |
| Gangnam Facility | Gangnamgu | 900(1.00) | 294(0.33) | 305(0.34) |
| Mapo Facility | Mapogu, Junggu, Yongsangu | 750(1.00) | - | 453(0.60) |
Reduction of generated MSW enabled the expansion of assigned area for 4 incineration facilities. Starting from 2007, the 4 facilities started to accept MSW of neighboring districts. Yangcheon Facility took MSW of Yeongdeungpogu and Gangseogu's waste as well as that from Yangcheongu. Gangnam Facility also started processing MSW of 7 other districts. Until today, 4 incineration facilities in Seoul are taking care of MSW from 22 local districts, among 25 districts in the city.
Before the facilities were shared, the 4 facilities were not utilized as much. As shown in the 2005 records, Yangcheon Facility processed only 33% of its capacity, Nowon Facility 19%, Gangnam Facility 24% and Mapo Facility 59%. This is because the local district and residents did not want the facilities to process waste from other areas. The reduced amount of MSW was a success, but this affected the incineration facility utilization rate, and concerns arose about the aging and malfunctioning of incinerators, pollution prevention facilities or controlling devices. While the facilities in Seoul were not effectively used, MSW from the city was sent to the Sudokwon Landfill Site (meaning landfill site capital region for the metropolitan Seoul), 45 km from Seoul. The cost and energy for transportation increased, causing problems for the Seoul Metropolitan Government which has built and run its own incineration facilities.
However, it is not recommended that local districts build and operate incineration facilities on their own, especially in terms of securing expert human resources. Because waste incineration facilities require high-end technology, and should be operated for 24/7, they require a large amount of human resources. Each incineration facility uses about 70 employees per facility, and there are many positions that require staff with national certifications, up to 12 to 20 such experts per facility. Of course, the operation costs are huge because certified employees are required in industrial safety, electronic, energy utilization, environmental pollution prevention, firefighting, high-pressure gas management and more. The size of facilities themselves is big as well. The operation cost for the 4 facilities ranged from 8.3 billion to 21.3 billion KRW in 2012. Barring the Mapo Facility, the facilities recorded losses in the region of 0.5 to 1.5 billion KRW. Therefore, the overall operation cost showed losses of 15.5 billion KRW, subsidized by Seoul Metropolitan Government (SMG). SMG and the central government paid 393.1 billion KRW, the entire construction cost of the facilities.
Table 3. Seoul City Incineration Facility Operation Profit (in 2012)
(Unit: 1 Mil. KRW)
| Category | Income | Expense | Profit (Income - Expense) |
| Yangcheon Facility | 3,236 | 8,384 | -5,148 |
| Nowon Facility | 4,659 | 14,606 | -9,947 |
| Gangnam Facility | 19,794 | 21,338 | -1,544 |
| Mapo Facility | 14,472 | 13,378 | +1,094 |
| Total | 42,161 | 57,706 | -15,545 |
Considering the above listed facts, it is more efficient for SMG, rather local districts, to run large and technology-concentrated facilities such as incineration facilities in terms of securing expertise and reducing costs.
To resolve the problems previously mentioned and reduce the overall operational costs, SMG began regionalizing its incineration facilities in 2001, by sharing the 4 facilities with neighboring districts. However, it was difficult to turn facilities of the metropolis into regional facilities. First of all, residents in the four incineration facilities' areas had to agree on such changes. Through the resident consultative group, the residents can deal with facility operation, their health and welfare. They also monitor waste composition, according to the agreement made with SMG. Until gaining agreements from the residents, SMG and resident consultative groups met and negotiated numerous times for 1 to 9 year period.
Sharing facility had positive effects on many aspects. First of all, the number of districts using the facilities increased to as many as 22 districts in 2014. Moreover, facility-sharing improved the utilization rate significantly from 19-59% (33% of the entire capacity) in 2006 to 77-92% (85% of the entire capacity) in 2012.
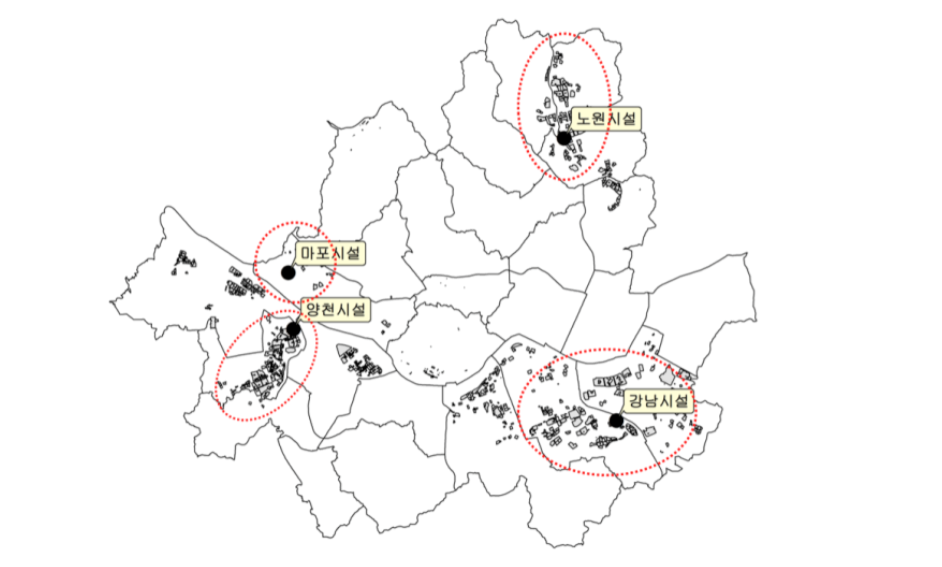
After sharing facilities, 4 incineration facilities were secured as regional facilities for 25 local districts, dividing Seoul into 4 areas in processing the MSW. 25 local districts that are sharing the facilities are divided as follows: Southwest Region (Yangcheon Facility), Northeast Region (Nowon Facility), Southeast Region (Gangnam Facility) and Northwest Region (Mapo Facility).

Figure 2. Facility Operation Rate and Changes in Districts after Sharing the Incineration Facilities


Figure 3. Incineration Facilities in Seoul and their Assigned Areas
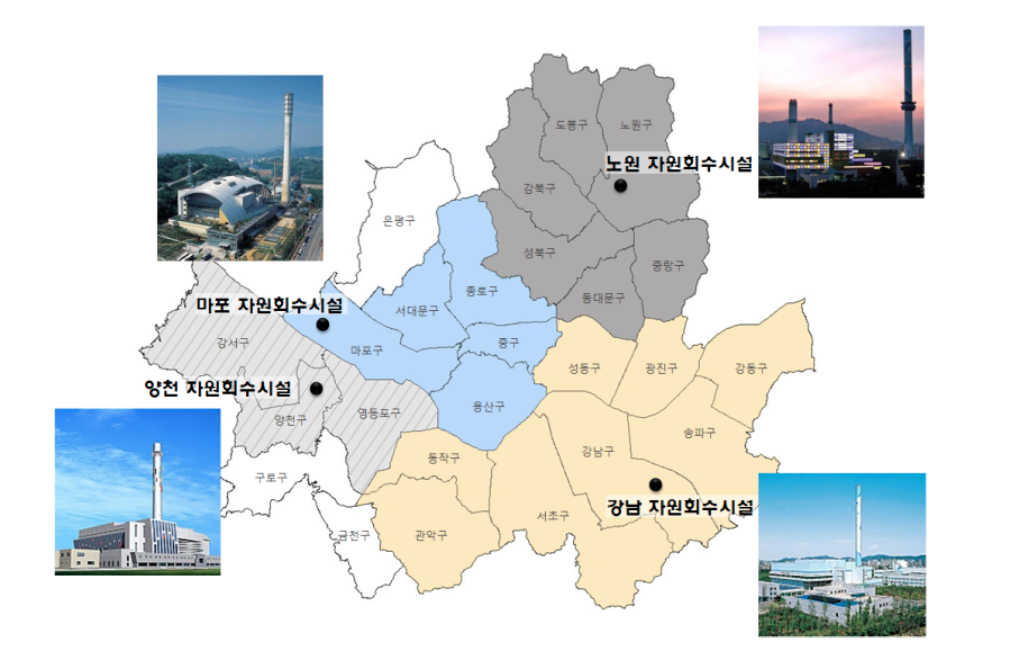

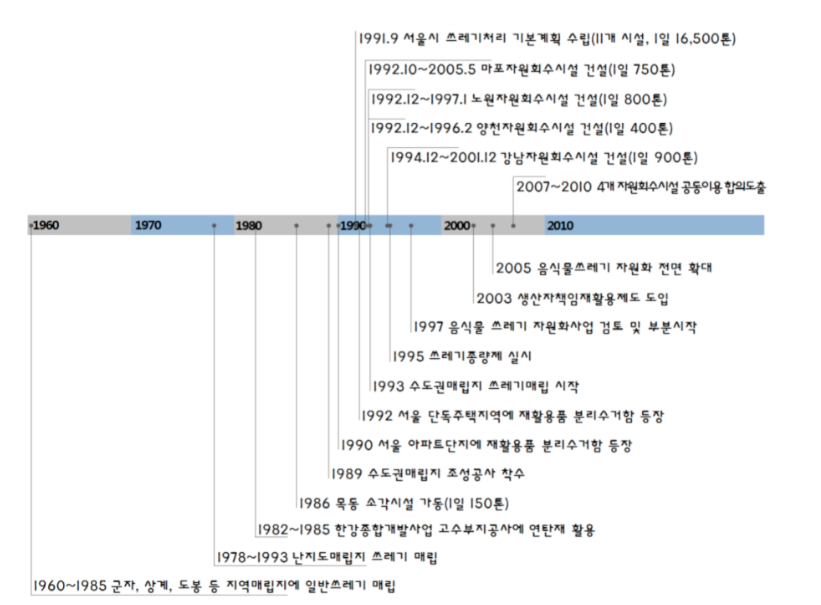
Figure 4. Construction of Incineration Facilities in Seoul and Major Changes in the Waste Management Policy
2) New Town Construction and Incineration Facility-District Heating Facility Cooperation
Cities in Korea rapidly developed over the last 60 years. Suburban areas were developed as housing sites to accommodate the population influx from the rural to metropolitan areas. Yeouido (1967) and Yeongdong (1967) were developed in the 1960s. In the 1970s, Jamsil (1971) was developed to disperse the concentration in Jongro and Junggu. In 1980s, the Gaepo (1981), Godeok (1981), Mokdong (1983) and Sanggye (1985) areas were all developed as large-scale residential areas.
During the construction of new town, 2 incineration facility sites have been secured where the Yangcheon Facility (May 1983, construction decided in Mokdong New City Development Plan) and Gangnam Facility (January 1986, city facility decided as waste disposal facility) were built. The other two incineration facilities have experienced similar situations. Mapo Facility had been constructed k in the World Cup Park, a part of the Sangam Housing Area which started its construction in 2000. Nowon Facility had its location assigned as a waste disposal facility in December 1977, before the Sanggye area was developed in1985.
As shown in the above examples, construction of incineration facilities connected to new town development makes it relatively easier to find construction sites, and to reduce objections from local residents that cannot be avoided in the construction process. Moreover, utilizing the heat from incineration as a heat source for district heating is another profit of connecting the construction of incineration facility with new town development. District heating started in Lock Part, New York, U.S.A in 1877, and spread to other parts of America, Europe and Japan. In Korea, the first such approach was the feasibility study on the remodeling of Seoul Thermoelectric Power Plant into cogeneration thermal power plant to provide heat in Yeouido, Dongbuichon and Banpo in 1981. The actual start was in Mokdong and Shinjeongdong, providing heat to 20,000 houses. After the first and second oil shock, the social interest in energy efficiency was high in the 1970s. In 1987, remodeling of the Seoul Thermoelectric Power Plant into cogeneration thermal power plant was determined. In 1989 district heat scheme was determined for 5 cities including Ilsan. Along with this trend, the 4 incineration facilities in Seoul could also be connected with district heating facilities. Yangcheongu provides heat to 140,000 houses, and the incineration heat ratio for district heating is 16%. Nowon provides heat to 128,000 houses at a 23% rate, and Gangnam to 176,000 houses with a 27% incineration heat ratio. The Mapo area shows the highest incineration energy rate, as much as 57%. Heat is provided to 70,000 houses.
Figure 5. District Heating and Location of Incineration Facility in Seoul
In other words, all four incineration facilities in Seoul have district heating facilities, providing heat from waste incineration. The heat recovered from the incineration takes up to 16-57% of the energy source of the district heating facilities.
Table 4. Incineration Facility․ District Heating Facility Cooperation Status
| Category | Yangcheon | Nowon | Gangnam | Mapo |
| Size of the District Heating Facility |
140,000 | 128,000 | 176,000 | 70,000 |
| Energy Recovered from Incineration Facility |
Heat Electricity |
Heat | Heat | Heat Electricity |
| Energy Source Of District Heating (2012) |
Heat from Incineration: 15.7% Heat from Energy Generation 51.0% Produced Heat: 33.3% |
Heat from Incineration: 23.2% Heat from Energy Generation 37.8% Produced Heat: 39.0% |
Heat from Incineration: 27.0% Heat from Energy Generation 12.7% Produced Heat: 60.3% |
Heat from Incineration: 56.8% Heat from Energy Generation 33.8% Produced Heat: 9.4% |
3) Environment Pollution Management
MSW incinerators are source of various pollutants such as incinerators, storage systems and transport vehicles. There are also general materials such as foul odor, dust and nitrogen oxide. Various characteristic pollutants from MSW incinerators also include hydrogen chloride, sulfur oxides and dioxin.
Dioxin, in particular, was a cause of concern in the early 1990s across the world because of the soldiers who were exposed to defoliant during the Vietnam War and their children who developed disorder. And at the same time waste incineration facilities became known as a major source of dioxin.
As a result, citizens started to question about incineration methods, and concerns arose among neighboring residents about facility and environmental measures. In response to such concerns, SMG has prepared thorough measures against environmental damage in terms of both facility installation and operation.
First of all, the city has installed and operated extremely complex gas purification facilities. The biggest concern among local residents is that of pollutants, emitted along with gas from incineration. This contains heavy metals such as mercury, caustic substances such as sulfur oxides and nitrogen oxide as well as toxic materials such as dioxin. Seoul's incineration facilities have neutralization, dust reduction and catalyst facilities to remove such materials, which consume more than 50% of the construction cost. Even during operation, considerable cost is expended in such facilities' chemical, energy and replacement of the air purification equipment.
The gas emission report in 2012 showed that all 4 of the facilities have less than 1/2 of emission standard, and other materials are also about 1/10 ~ 1/1,000 of the standard, suggesting strict management of the emission.
Table 5. Gas Emission Report of Incineration Facility in Seoul (2012)
| Category | Emission Standard | Yangcheon | Nowon | Gangnam | Mapo |
| Dust (㎎/S㎥) | 20 | 2.07 | 1.74 | 1.14 | 0.88 |
| Sulfur Oxides (ppm) | 30 | 0.43 | 0.14 | 0.29 | 0.34 |
| Nitrogen Oxide (ppm) | 70 | 23.00 | 23.78 | 12.39 | 16.67 |
| Carbon Monoxide (ppm) | 50 | 10.30 | 7.16 | 10.55 | 1.07 |
| Hydrogen Chloride (ppm) | 20 | 2.26 | 0.48 | 2.73 | 1.15 |
| Dioxin (ng/N㎥) | 0.1 | 0.000~0.009 | 0.000~0.003 | 0.000~0.002 | 0.000~0.000 |
|
※ Dioxin Emission Standard Strengthened: 0.5→0.1ng/N㎥(2003.7) |
|||||
Second, disposed waste is examined so that the incineration facility will not have toxic materials. Blocking the pollutants from the incinerators are as important as operating excellent pollutant restriction facilities.
Heavy metals, such as mercury, are included within the waste material and spread into the atmosphere during the incineration process as gas. Dioxin is known to be formed when aromatic material and chlorine are combined during the incineration. Types of waste capable of generating dioxin include food, waste with high water contents and PVC products. Thus, dioxin is generated during the incineration of the waste. Therefore, such materials are asked to be separately disposed by houses and businesses.
Despite strict management and guidelines, we cannot rule out the possibility of such materials being mixed in the waste. Therefore, the incineration facilities search transport automobiles at random for heavy metals and have them return if such materials are found. The automobile will then receive a penalty. It is meaningful that such investigation and monitoring is done by people recommended by the resident consultative group. They work whenever waste is being brought into the facility. Right after food waste recycling completed, about 10-20% of food waste contained in the waste used to be brought into the incineration facilities. But now it is maintained at a rate lower than 5%. This is because there is thorough and vigilant observation on the waste.
Third, air pollutants are measured in real-time and statistics are displayed. This is one of the representative management systems, along with thorough purification facilities and examining waste brought into the facilities. The system measures pollutants in emitted gas in real time, and then displays these figures to the public. The figures include the tele-monitoring system, auto dioxin collection and electronic displays of gas density. To secure the objectivity of these figures, facility operators cannot approach such measurement devices. Among the devices, the tele-monitoring system automatically measures dust, SO2, HCI, NOx, CO and O2, flow amount and temperatures with device installed in the middle of the incinerator chimneys, and then transfers the results to the central control room and the government's control center in real time.
At the same time, results are displayed on electronic displays, so that local residents can see the numbers. 3 electronic displays have been installed in Gangnam, and 1 each for Yangcheon, Nowon and Mapo. Dioxin is the least-trusted pollutant by the residents. Dioxin cannot be measured in real-time, unlike other pollutants. Therefore, the material should be collected once every 6 months (within 1 day), and the collected material is then moved to labs for analysis. Therefore, the residents did not trust the results because of the time period without measurement, and the possibilities of material manipulation. To resolve the distrust and overcome the limitation in the measurement method, Seoulhas installed auto dioxin collectors in all of the 4 facilities' chimneys. The kit absorbs and stores 3-6 months of dioxin from the gas, and the amount can be calculated based on the collected amount and the period. The kit is utilized to analyze dioxin density, and the new kit is replaced to collect dioxin in the following period.
Figure 6. Gas Emission Electronic Display Board and Auto Dioxin Collector
Gas Emission Electronic Display Near the Incineration Facility  |
Auto Dioxin Collector Kit 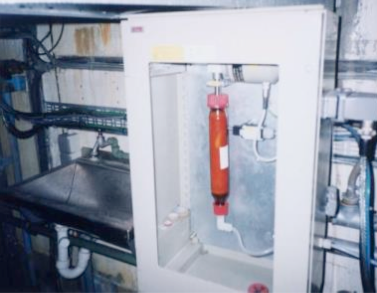 |
Fourth, the time and number of garbage truck is limited. Waste transportation causes odor, emits exhaust fumes and increases traffic on roads. To resolve such issues, the waste is brought only in the night and early morning so that citizens are exposed less and the roads used more efficiently. Moreover, waste coming from the districts other than the facilities' own districts should be transported with automobiles more than 11 tons in capacity. The number of automobiles operated is fundamentally restricted.
Policy Effects
1) Landfill Reduction
Seoul does not have a landfill within its city, and there is a very low chance that the city will have one even in the future. Therefore, reducing the amount of landfill waste is the core task of management of MSW. In this sense, sharing the 4 facilities in Seoul is contributing significantly to reducing landfill of MSW in Seoul.
The amount of waste landfilled in 2012 was only 10% of the amount in 1997, which was right after Yangcheon and Nowon facilities began operation. First of all, the overall waste amounts (incineration + landfill) had been reduced to a 1/3. Moreover, the incinerated waste increased up to 3-4 times compared to that of the 1997 record. The landfill rate had thus been significantly reduced from 93.6% in 1997 to 25.4% in 2012.
If facilities were not shared and the incinerators only processed local districts' waste (Yangcheongu, Nowongu, Gangnamgu, Mapogu, Junggu, Yongsangu, Junggu, Yongsangu), the landfill rate would have remained the same as 2006, about 76.3%. The statistics explained above are also reflected in Seoul City's waste management record. After facility sharing commenced, the landfill rate was about 7.8% in 2012 (it was 61.9% in 1997).
Table 6. Change in the Landfilled Amount after Sharing Facility
| Category | Before Sharing | After Sharing | |||
| 1997 | 2003 | 2006 | 2010 | 2012 | |
| Incineration Facility | Yangcheon Facility Nowon Facility |
Yangcheon Facility Nowon Facility Gangnam Facility |
Yangcheon Facility Nowon Facility Gangnam Facility Mapo Facility |
Yangcheon Facility Nowon Facility Gangnam Facility Mapo Facility |
Yangcheon Facility Nowon Facility Gangnam Facility Mapo Facility |
| Incinerated Amount in 4 Facilities (Ton, ) | 187,096 | 162,795 | 320,562 | 740,287 | 771,110 |
| Landfilled Amount (Ton, ) | 2,730,200 | 1,866,096 | 1,033,738 | 527,790 | 262,435 |
| Incineration + Landfill (Ton, =) | 2,917,296 | 2,028,891 | 1,354,300 | 1,268,077 | 1,033,545 |
| Landfill Rate (%. /) | 93.6 | 92.0 | 76.3 | 41.6 | 25.4 |
| Landfill Rate (%), based on domestic waste) | 61.9 | 42.4 | 24.8 | 14.4 | 7.8 |
2) Energy Reduction
The low-heating value of MSW waste brought into the incineration facilities in Seoul is 2,762 kcal per 1 kg. Seoul's incineration facilities can recover about 74% of the heat generated from incineration. The facilities use part of the heat in their operations, and sell the most of the remaining heat to neighboring district heating facilities. Energy sales recorded before sharing facility was 561,411 Gcal in 2006. The number increased to 1,269,336 Gcal in 2012, after the facilities began their shared operations.
Before sharing facility, about 52,000 households could get heat and hot water from the recovered energy. After sharing, the recovered energy increased and over 50,000 more households were able to get heat.
Utilizing heat from incineration also has a significant meaning in terms of the environment. The incineration heat can be used for heating water and house, and this leads to reduction in LNG. The carbon dioxide emissions can be reduced, leading to reduced greenhouse gas emissions. The reduced amount of greenhouse gas emissions was recorded at 27,000 tons in 2006 and 60,000 tons in 2012. This is as much as emissions from 540 busses in Seoul in one year.
Table 7. Comparison of Energy Substitution Effect of District Heating, Before and After Sharing Facility
| Category | Before Sharing (2006) |
After Sharing (2012) |
Note |
| Amount of Incineration Heat Sold (Gcal) |
561,411 (1.0) |
1,269,336 (2.3) |
‣ Yearly heat and hot water use per house: 10.9 Gcal |
| Amount Substituted for Gas (LNG ㎥) (House) |
59,597,770㎥ 51,506 Houses |
134,749,045㎥ 116,453 |
‣LNG 1 N㎥ = 9,420 Kcal ‣ Yearly heat and hot water use per house: 10.9 Gcal |
| Reduction in Greenhouse Gas Emission (Ton CO2) (City Bus, Unit) |
26,725 Tons 239 |
60,426 Tons 540 |
‣LNG 1 N㎥ = 2.23 kg CO2 ‣ Seoul City Buses' Greenhouse Gas Emission: 112 Tons CO2 |
Major Challenges and Solutions
1) Objection from Local Residents, following Incineration Facility Installation
From the planning stage, installation of incineration facilities had been stubbornly objected to by the majority of citizens, as they were understood to create pollutants including dioxin.. During construction, neighboring residents objected that their property values were being damaged along with the contamination of the environment. Due to severe objections, questions were also raised as to why SMG was building the facilities, rather than letting the 25 districts build them on their own.
Much time was spent due to the disputes with the residents. During such period, public attention gave been shifted to resource recycling. A total of 14 years (1992 ~ 2005) was spent building the 4 facilities, and there have been 396 complaints from nearby residents. The complaints usually were in the form of group demonstration (67%), and the rest were objections through documents. The main objections varied from fundamental disagreement with the construction itself, changes of plans such as relocation, reducing the capacity, installation of strict pollution controlling facilities.
Much time was spent due to the disputes with the residents. During such period, public attention gave been shifted to resource recycling. A total of 14 years (1992 ~ 2005) was spent building the 4 facilities, and there have been 396 complaints from nearby residents. The complaints usually were in the form of group demonstration (67%), and the rest were objections through documents. The main objections varied from fundamental disagreement with the construction itself, changes of plans such as relocation, reducing the capacity, installation of strict pollution controlling facilities.
Solutions
Long-term and regular medical checkup of the resident has been conducted. Seoul started health t monitoring for exposure in 2000 to track residents' health issues that can result from the incineration facilities. The city also has operated pollution-controlling facilities, limiting traffic and observing the waste materials. The monitoring is to track the health of neighboring residents who could be affected by dioxin and other toxic materials from the incineration facilities. At the same time, the monitoring helps evaluate environmental impacts in objective terms. This enables us to confirm the safety of such facilities, resolve concerns of the residents, and in case such negative impacts occur, find a solution to the issue. The investigation can be divided into 3 types in a broad sense: air quality assessment (environmental impact), assessment of the dioxin and heavy metal in residents' blood (impact on human body) and assessment of the general health and mental status (health impact). Fixed research groups, volunteers and facility employees undergo human body and health investigations. Recently, the investigation has been reduced only for the fixed research group. On the contrary, more pollutants were added such as dioxin in atmosphere or black carbon density. The 10th investigation was conducted in 2014. Assessed items, methods and targets are decided upon agreement with resident consultative group. Investigations up to this day have not shown any negative impact on the environment, human body or health from the incineration facilities.
Table 8. Assessment of Health of Residents around Incineration Facilities in Seoul
| Assessment Period | 2000 ~ 2004 | 2005 ~ 2008 | 2009 ~ 2012 | 2013 ~ 2015 |
| Number of Assessment | 3 Times | 3 Times | 3 Times | 3 Times |
| Target Areas | Yangcheon Facility, Nowon Facility, Gangnam Facility related and reference areas | |||
| Assessed Items | ‣ Environmental Impact Assessment: Dust, heavy metal, odor ‣ Impact Assessment on Human Body : Dioxin and heavy metal in blood, etc. ‣ Impact Assessment on Health: Medical checkup, recognition and evaluation on quality of life |
‣ Same as step 1 and 2
‣ Added dioxin evaluation in atmosphere ‣ Added 'autumn season to environmental impact assessment
|
‣ Same as step 3 ‣ Traffic impact assessment out of environment impact assessment (black carbon, etc.) |
|
| Assessed Group | Separate Assessment on Residents and Workers in Affected Areas and Control Areas | Separate Assessment on the Residents in the Affected Areas' | Assessment on Local Residents in Affected Area's | |
| Assessment Method | Separate Follow-up Study on the Control Group | Follow-up Study on the Separate Control Group and Affected Group | Follow-up Study on the Affected Group |
Follow-up Study on the Affected Group |
| Assessed Population | ‣Heavy Metal: 270 ‣Dioxin: 53 |
‣Heavy Metal: 270 ‣Dioxin: 75 |
‣Heavy Metal: 270 ‣Dioxin: 100 |
‣Heavy Metal: 360 ‣ Dioxin ․ Tumor Marker:100 |
| Note | ‣ Dioxin investigation targets increased | ‣ Dioxin investigation targets increased | ‣ Tumor Marker examination added ‣ Traffic effect evaluation added ‣ Comparison of diseases with district-based statistics from National Health Insurance Corporation |
|
Program to enhance convenience local residents
Subsidy is provided in heating cost for public housing, monthly maintenance fee or rent, environmental improvement costs (waterproof or painting), facility fees or medical costs for residents in affected area. Main targets of subsidy are residents within 300m radius of the incineration facility boundary. A total of 12,367 households including 3,413 households for Yangcheon Facility, 6,190 households for Nowon Facility and 2,934 households for Gangnam Facility. The fund is called as Resident Support Fund, created in accordance with ordinance of SMG. The fund is secured from grants of SMG, of districts sharing facility and profits from the grants management. Seoul's grant includes grants for constructing the incineration facilities and subsidies for heating facility in affected areas (within 70%) and grants fee on bringing in the waste. Subsidy for fee on bringing in the waste includes 10% for total waste, and additional 10% paid by neighboring districts that share the facility. Fund from sharing districts are decided based on facility-sharing agreement. As for Yangcheon Facility, sharing districts will pay 21,000 KRW fund per 1 ton, separate from the waste fee. The fund's profit is mainly interest from banks. The total amount of Resident Support Fund is 169.9 billion KRW from 1996 (when Yangcheon Facility started its operation) to 2013. The fund for waste brought into the 4 facilities is 25,260 KRW per 1 ton. Affected areas will receive about 13.56 thousand KRW per 1 house.
Table 9. Resident Support Fund Statistics (1996~2013)
| Category | Total | Yangcheon Facility | Nowon Facility | Gangnam Facility | Mapo Facility |
| Resident Support Fund (Mil. KRW) |
169,945 | 45,230 | 63,765 | 60,275 | 675 |
| Affected Population (Household) |
12,537 | 3,413 | 6,190 | 2,934 | 0 |
| Incinerated Amount (Ton) (1997~2013) |
6,727,728 | 1,389,705 | 1,767,559 | 2,023,626 | 1,546,838 |
| Resident Support Fund (KRW/Ton) |
25,260 | 32,547 | 36,075 | 29,785 | 436 |
| Resident Support Fund (1,000 KRW/Households) |
13,556 | 13,252 | 10,301 | 20,544 | - |
Continuous efforts to earn the trust of local residents
There can be various reasons for residents to be opposed to the construction of incineration facility. The representative ones include drop in the property value, pollutant emission followed by impacts on the environment, health and human body. Traffic inconvenience due to increased number of garbage trucks is also included.
Drop in the property value does, in fact, occur. However, the effect becomes clear when the dispute becomes extreme including demonstrations. Where there are no disputes, the impact on real estate disappears. However, Seoul has offered subsidies for heating costs, maintenance fees, rent, facility fees, medical checkup costs and more, based on the decision that the possible impact and concern can also be counted as damage to neighboring areas. The Resident Support Fund founded from 1996 to 2013 is offered about 1,356 thousand KRW per house.
Seoul has taken a few measures to restrict damages to neighboring areas that can be affected by air pollutants. Representative residents can take part in observing the facilities to help ensure that there is no water, food waste or toxic materials in the waste. When caught, the waste is not brought into the facility and the automobile is temporarily suspended from operation. Moreover, air pollution is measured in real-time and displayed on electronic display board. Materials that cannot be tracked in real time are collected for more than 3 months in a tracking analysis. Moreover, resident health monitoring has been conducted since 2000 to help better understand the impact on the environment, human body and health.
The various measures are not in place because the problems arise. They are in place to build trust with the residents. The same methods can be used for other waste disposal facilities, such as food waste or landfill sites.
Presentation for residents, complaint acceptance
Seoul has opened 121 public discussions and presentations to collect residents' opinions regarding the construction of incineration facilities. Neighboring residents strongly objected to the construction, and the result was reduced capacity for both the Nowon Facility and Gangnam Facility. Therefore, Nowon Facility's capacity has been reduced to 800 tons from 1,000 tons, and the Gangnam Facility to 900 tons from 1,900 tons. Moreover, the Gangnam Facility was at first promoted to be shared with the Songpagu region, but used only by Gangnamgu.
The discussions and negotiations were done over a period of 3 to 13 years. Since the project periods were extended, there have been difficulties in pursuing the plans because at times the land was used for other purposes, or budgets were changed.
A lot more time was also required to obtain agreements from the residents, to use the 4 facilities as regional facilities. For the Gangnam Facility, SMG and the resident consultative gropu had about 160 meetings over the course of 5 years. The agreement on sharing facility was finalized on May 7th, 2007. As many as 100 meetings were held for the Nowon Facility, and the agreement was concluded on June 30th, 2007. Mapo had had 40 meetings over 1 year, and was settled on February 10th, 2009.
It took relatively longer for Yangcheon Facility: 9 years. There had been 150 meetings, and the agreement was finally made on May 10th in 2010.
Subsidiary Facilities for Residents
These regional incineration facilities have various subsidiary facilities such as swimming pools, fitness centers, golf courses, cultural lecture halls, study rooms and auditoriums. Those facilities are provided for the local residents at low cost.
Table 10. Subsidiary Facilities in the Incineration Facilities in Seoul
| Category | Yangcheon Facility | Nowon Facility | Gangnam Facility | Mapo Facility |
| Construction Period | 1992.12~1996.2 | 1992.12~1997.1 | 1994.12~2001.12 | 2001.12~2005.5 |
| Area | 14,627㎡ | 46,307㎡ | 63,813㎡ | 58,435㎡ |
| Construction Cost (Subsidiary Facilities) |
32.1 Billion KRW (8.1 Billion KRW) |
74.3 Billion KRW (9.4 Billion KRW) |
115.5 Billion KRW (9.4 Billion KRW) |
171.2 Billion KRW (9.5 Billion KRW) |
| Subsidiary Facilities | Swimming Pool Fitness Center Study Room Auditorium |
Swimming Pool Fitness Center Cultural Lecture Hall Study Room |
Swimming Pool Fitness Center Cultural Lecture Hall Study Room |
Sauna Fitness Center Golf Driving Range Study Room |
2) Incineration Facility Installation and Management - Roles and Costs
Seoul has been divided into 25 local districts for the administrative convenience. It is the same as other metropolis, composing physical boundaries for the administrative convenience. However, the boundaries act against securing sites for non-preferred facilities such as waste landfill or incineration. It can be preferable for each district to have its own facilities, but disputes will arise. Having facilities for each district will also cause size to be reduced and therefore a loss of efficiency will be dropped. Reduced size also hinders stable operation of pollution prevention facility.
This is why metropolitan governments, rather than regional districts, install and operate large-scale waste disposal facilities such as incinerators or landfills. Along with Seoul, Tokyo in Japan, London in Britain, and Paris in France operate the same way. Another common factor is that local districts take care of waste collection, transportation and recycling in many metropolises including Seoul. This is because local districts may have more direct contact with residents so it is easier for them to ask for the residents’ cooperation than the metropolises, therefore, they can collect waste more efficiently.
Although the local districts and metropolises have clearly different roles, the needs and location selection needs to be flexible enough to be based on the opinions and requests of the local districts. In particular, it is desirable for local districts to determine the location and capacity of the facilities and districts that will share the facility. This is because the local districts, rather than metropolises, can understand the residents and the needs for the waste management better. For example, it took 7 years for the Gangnam Facility to be designed and completed because disputes continued over both the capacity and location even after construction started. On the other hand, for Mapo Facility, it took only 3.5 years, because the capacity, location and districts that will share the facility were all decided before the construction started.
Figure 7. Bottom–Up type Construction Process of Incineration Facility
| Local districts' request for installation of facilities | - Facility capacity (more than 400 ton per day considering the heat recovery efficiency) - Agreement from the districts that will share the facility - Multiple candidate locations for the facility in the districts |
| Basic Design | - Regions that will share the facility - Quality and quantity of the waste - Role division between the sharing districts that will share the facility |
| Determination and announcement of Location selection plans, selection of candidate locations | - Foundation of location selection council - Check-out of accessibility and resident status - Safety in land size, ground quality, and vulnerability to water related disaster, landslide, and cracks - Restrictions such as cultural artifact, school, military facility, height limits and water supply protection |
| Candidate Locations Search | - Suggestion of support measures to local community and affected region - Results of Environmental Impact Assessment when the facility is installed |
| Location selection and announcement | - Agreement from residents of affected areas (for Hanam Facility, consents from 2/3 of residents) - In case there is no affected area, agreement from residents of Tong and Ri (for Hanam Facility, consents from 2/3 of residents) |
| Selection of Construction company (preliminary design, impact assessment) |
- Examination of preliminary designs - Evaluation of technological capability and past construction records - Construction cost evaluation |
| Presentation for residents | - Preliminary designs and environmental impact assessment- Collect resident opinions |
| Detailed design and construction commencement | - Reflect resident opinions - Selection of affected areas selected within 2 years of establishing installation plan of waste disposal facility, foundation of resident consultative group, performance of environmental impact assessment |
| Test operation and pre-performance test | - Witnessed by resident representative, or designated organization - Supplementary construction in case of errors |
| Commencement of Construction and operation |
- Various examinations on facility performance - Dioxin density measurement - Environmental impact assessment |
References
- Seoul Metropolitan Government, 1991, 「 Seoul Metropolitan Government - Basic Waste Disposal Plan」
- Seoul Metropolitan Government, 2013, 「2012 White Paper of Environment: Seoul's Environment」
- Seoul Metropolitan Council, 2006, 「Studies of Resource Recovery Facility Productivity Improvement」
- Yoo Gi Yeong, Jo Hang Mun, Kim Gui Yeong, 2013, Studies on Integrated Operation's Efficiency for Seoul City Group Energy Facilities and Environmental Facilities, Seoul Institute
- Lee Beomhyeon, 2012, 2011, Economic Development Experience Module Project: Korean New City Development, Ministry of Land, Transport and Maritime Affairs, Korea Research Institute for Human Settlements
- Korea District Heating Corporation Hwaseong Branch, 2013, 「Handbook of District Heating Facilities」
- Ministry of Environment, 2013, 「National Waste Generation and D