سياسة إدارة المياة في سيول
Water Management Environment & a Changing Paradigm
The concept of water management has existed since prehistoric times. When states were formed, water management became one of the most important pillars of government power.
While water is a resource that people cannot do without, it can also bring irreparable damage. It thus had to be kept in check as well as managed for human use. Reservoirs or embankments would normally be used to maintain water flow but were ineffective as a means to control water during floods (Joongang Daily, 2001).
Until modern times, water management was linear in a sense, and its sole purpose was to manage water supply and make the most effective use of it. In other words, people would intervene through social and economic means to utilize and manage the water from the rain that flows into the rivers and lakes, after which the water would once again be released into the ocean.
Today, water management has to be cyclic in nature in order to meet increasing demands, not simply due to climate change or economic considerations. Water needs to be managed in a sustainable way through the generations because this is what is required by the times and what is needed in order to develop the relevant policies.
While Seoul realized compressed growth in a relatively short period of time, its water management system (including waterworks and sewer lines) has also improved dramatically. We will examine Seoul’s policy changes and experiences and what lessons can be learned.
Status
Introduction
Seoul sources all its water from the Han River. After treatment, it is piped to taps all over the city.
The raw water that the city uses comes from intake points located in Seoul (Gangbuk, Jayang, Pungnap, Amsa) and the City of Namyangju (Gangbuk). As of 2013, the total capacity was 7,120,000 m3/day. Seoul has 6 purification centers (Arisu Purification Center ) with a daily processing capacity of 4,350,000 m3, and average production around 3,166,000 m3/day.
The tap water produced at the purification centers is supplied through a network of pipes to residents, the final users. The total length of the waterworks pipes in Seoul is 13,792 km , greater than the Earth’s diameter (12,756.2 km). The key facilities for the tap water supply are distribution stations and pumping stations. There are 104 distribution stations in Seoul, with a total distribution capacity of 2,418,000 m3. Even if the water production and supply facilities were to encounter an emergency, everyone would be supplied with water at a normal rate for 17 hours. Facilitating the supply are 196 pumping stations: 4.6% of these are manned, while the rest are unmanned.
As of 2014, the flow rate was 95.4%, one of the best in the world. Leakage is kept very low, within the 3% range.
To respond effectively to algae and new types of unregulated harmful substances, Seoul has been working to introduce advanced purification facilities since 2007, with installation to be complete at all purification centers by 2015.
While the city has one of the world’s best tap water production and supply systems, many residents are not confident about the quality of the tap water. Increasing the public’s trust through communication remains one of the most important tasks for Seoul. The amount of water flow rate is very low compared to cities in the US or Europe; this is a major factor that is detrimental to the financial health of the waterworks system as well as to ensuring safety and security.
Access to the sewer system in Seoul stands at 100%. As of 2013, 3.16 million m3/day of sewage water can be processed at 4 water treatment centers, with 3 other facilities dedicated to processing solid human waste (10,500 m3/day).
Sewer pipes in Seoul were installed with a secondary purpose of draining stormwater (to prevent incidents/accidents) and were used as part of the combined sewer system by connecting to the drainage pipes for domestic wastewater. This however resulted in a number of issues such as drainage. From 1992, the city took measures to restore the intended functions of the sewer pipes – the fundamental infrastructure of the city. An internal investigation of its sewer pipes by zone was completed in 2001 to learn more about the conditions of the sewer pipes, and maintenance was carried out on a systematic basis to replace deteriorating, damaged pipes and those otherwise unable to properly perform their function of draining.
Flooding from heavy rain is largely caused by insufficient sewer pipe and stormwater pumping station capacity. Moreover, climate change is expected to increase the occurrence and severity of torrential rain, while urbanization increases the impervious surface area, exacerbating the potential for flood damage.
In a quantitative sense, Seoul’s waterworks and sewer systems are sufficient. One of the policies that the government should prioritize for the future is development of an integrated water management system that will improve quality and sustainability. South Korea has enjoyed dramatic quantitative growth and achieved qualitative stability. Now that Seoul has the waterworks and sewer infrastructure in place, it needs to focus more on improving the effectiveness of operation and management of the facilities. At this juncture, it is imperative that Seoul carefully reviews the potential for an integrated management system.
Geographic Conditions & Overview
Located in the central west section of the Korean peninsula, Seoul is divided through its center by the Han River. On the northern end of the city is the administrative district called Dobong-dong (Dobong-gu); on the eastern end is Sangil-dong (Gangdong-gu); the southern end is Wonji-dong (Seocho-gu); and the western end is Ogok-dong (Gangseo-gu). Seoul is comprised of 25 gu administrative counties, with 423 dong administrative districts. As of December 2014, the city’s population was 10,103,000, accounting for 19.7% of the nation’s population (51,328,000). Seoul is 605.41 km2 in area, about 0.28 % of the total national territory (0.61 % of South Korea). The city is 30.30 km north to south, and 36.78 km east to west.
When the Joseon Dynasty was founded in 1394, Seoul soon became the kingdom’s capital and has been ever since. It is now the center of politics, economics, industry, society, culture and transportation.
The administrative zone increased to 593.75 km2 in January 1963, and by March 1973, it encompassed 605.30 km2. In the 1970s, rapid urbanization sent developers to the south of the Han River. After the Asian Games in 1986 and the Olympics in 1988, Seoul grew onto the world stage.
In 1991, local governments were granted more power to govern themselves through a policy of local autonomy. The year 1994 was the 600th anniversary of Seoul as a capital city.
Seoul is located at 37.34 N latitude and 126.59 E longitude and is divided by the river system of the Han River and 4 streams (Cheonggye, Jungnang, Tan, and Anyang), surrounded by mountains on all 4 sides. To the north is Bugak Mountain, to the east is Nak Mountain, to the south is Nam Mountain, and to the west is Inwang Mountain. On the outer edge are Bukhan Mountain (north), Deogyang Mountain (west), Gwanak Mountain (south), and Yongma Mountain (east), together forming a double basin.
The city center is at 25 – 40 m altitude, with some 40% of the total city area at or below 30 m; 27% is above 70m, precluding development as a city area; 27% is at the middle range; and 6% is occupied by the river systems.
To the east, the average altitude is within the 35m range, both north and south of the Han River. In Jongno, Jung-gu, Seongbuk, Seodaemun (all north of the Han) in the center, the average altitude is higher, at around 50 m, with a similar situation in the Gwanak and Dongjak areas south of the river. Mapo, west of the Han, and Yongsan to the north are relatively low, at 25m.
River & Water Systems
The Han River is formed by the Namhan and Bukhan rivers that converge 35 km upstream to the northeast of Seoul. The river cuts through the center of Seoul from east to west, joining the Imjin River before flowing into the West Sea to the north of Incheon.
The total length of the Han is 494.44 km, which has a drainage area of 25,953.6 km2.
The effective basin width is 47.19 km, with a shape factor of 1.95. It is a combination of dendritic and fan shapes. The river winds and meanders and is quite wide compared to its length, making it difficult to utilize and manage. Because the river is shorter than might be expected due to the size of its drainage area, the peak flow is high, resulting in considerable flood damage. This phenomenon is concentrated on the gently sloped Namhan River and the main stream. The channel slope is the 1/250 point upstream of convergence, and at the 1/5,000 point of the main stream.
Within Seoul, 36 small and medium streams flow into the Han, with total length of the streams in aggregate being 247.99 km.
Stream planning has been divided into zones: Jungnang (Cheonggye Stream, Jungnang Stream), Tan Stream (Tan Stream, Yangjae Stream), Nanji (Bulgwang Stream, Hongje Stream), and Seonam (Anyang Stream).
Changes in Urban Development & the Water Reclamation System
The population of Seoul began growing in earnest in the 1960s when urban development began to take off, and continued to grow until the early 1990s. This growth was reduced somewhat in the 1990s but soon stabilized within the 10 million range in the 2000s (Figure 1).

| Population | No. of Households | People per Household | Population Density | |
| 1962 | 2,983,324 | 554,136 | 5.38 | 5,001 |
| 1972 | 6,076,143 | 1,182,655 | 5.14 | 9,912 |
| 1982 | 8,916,481 | 2,000,678 | 4.46 | 14,370 |
| 1992 | 10,969,862 | 3,383,169 | 3.24 | 18,121 |
| 2002 | 10,280,523 | 3,623,929 | 2.84 | 16,978 |
| 2012 | 10,442,426 | 4,177,970 | 2.50 | 17,255 |
The noticeable demographic change during this period is the number of persons per household, which fell drastically from 5.4 in the 1960s to 2.5 in 2012 (Figure 2). In 2014, the percentage of single-person households exceeded 25%, a trend which is likely to become more dominant in the future. These demographic changes are important factors that affect the pattern of water use and the water reclamation system, and should be taken into account in Seoul’s water management policies (Table 1).
Seoul’s urbanization began in earnest in the 1960s. Before that time, urbanization policies were mostly focused on restoring the social infrastructure that had been destroyed in the Korean War.
From the 1960s to 2012, the city’s population grew 3.5 times, from 3 million to 10 million. The number of households went up 7.5 times, from 550,000 to 4.17 million. However, growth was not confined to population or household. Migrant population and urban concentration accelerated, aided by development of the export industry complex in Guro-dong (1964) and construction of the expressways (late 1960s).
Such a drastic increase in population and urbanization brought about hydraulic changes in the city. One example is the increase of impervious surface area, adversely affecting the water reclamation system (Figure 3).
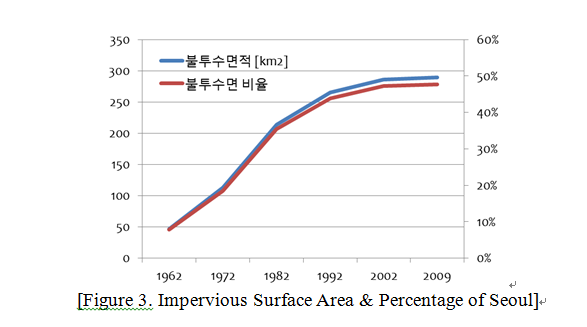
The impervious surface area as a percentage of Seoul was 7.8% in 1962 and 47.1% by 2002, an approximately 6-fold increase. During the rainy season, surface runoff that had equaled 502,000 m3/day (1962 – 1971) had also increased 6 fold to 2,990,000 m3/day (1995 – 2004). The total runoff in the dry season was 375,000 m3/day between 1962 and 1971, but fell to 183,000 m3/day between 1995 and 2004, a decrease of about 49% (Kim Yeong-ran, 2012).
The increase in impervious surface area due to urbanization also brought the peak flow up during heavy rainfall while reducing natural flow, causing streams to run dry on clear days.
Seoul’s population density grew 3.5 times, from 5,001 persons/km2 in 1962 to 17,472 persons/km2 as of 2010 (Kim Yeong-ran 2012). The amount of daily floating population from the surrounding satellite cities also jumped. The rising population and density caused many issues in water management such as reduction in the natural flow and increased stream intake, use of groundwater, expelled stormwater and wastewater, incidence of dry stream beds, ecological risks, and urban pollution.
Water Volume & Quality Management
The total volume of water resources in Seoul is 940 million m3/year, with 690 million m3/year available for use (Seoul Development Institute, 2011). Water use equaled 13.4 billion m3/year as of 2009, and is steadily increasing. The water resources reserve accounts for 70.3% of the total water use, 12.6 billion m3/year (94.1%) of which is supplied from outside, while only 78 million m3/year (5.9%) is sourced internally. The city depends heavily on the outside for its water. This is detrimental not only to overall supply but also to the sustainability of water reclamation in the long term.
With the launch of the Comprehensive Han River Development, more sewage treatment centers were built in the 1980s. The quality of water began to improve thanks to continued efforts in building septic tanks and sanitation facilities and strengthening regulations on wastewater discharge facilities. From 1994 however, droughts began to occur in the winter while more domestic wastewater was drained upstream of the Han River from large apartment complexes. The situation was made worse by the increasing number of restaurants and accommodation facilities near the protected reservoir area, degrading water quality again. This degradation continued until 1997 (Seoul Metropolitan Government, 2014).
The improvement of water quality after 1997 was largely due to action at the government level, including: i) institutional support such as development of the Special Water Quality Management Plan for Paldang Reservoir and the Han River System (1998), enactment and promulgation of the Act on the Improvement of Water Quality & Support for Residents of the Riverhead of the Han River System (1999), and designation of the Jamsil Water Reservoir Protection Area (1995) and Waterfront Areas (1999); and ii) continued efforts to improve water quality by strengthening guidelines and regulations on wastewater discharge facilities (Seoul Metropolitan Government, 2014).
Upstream of the Han, water quality is maintained at a higher level (BOD 1.6 mg/L or lower); than midstream and downstream, where BOD levels are between 2.1 and 2.2 mg/L.
In Jamsil, BOD was 2.6 mg/L in 1997, but from the following year, this began steadily decreasing to 1.7 mg/L in 2004 and 1.4 mg/L in 2005, thanks to measures taken to improve water quality at the upstream reservoir. Since 2006, BOD levels have remained between 1.1 and 1.9 mg/L – ‘Good (I b)’ – for reasons that include introduction of non-point source pollutants in the dry season and changes with the precipitation and discharge rate from Paldang Dam. At Gayang Point, the level was 5.5mg/L in 1997, falling to 2.9mg/L in 2005 and remaining between 2.5 and 4.5mg/L (‘Fair (III)’) between 2006 and 2010. After 2010, quality improved again and is normally 2.2 mg/L.
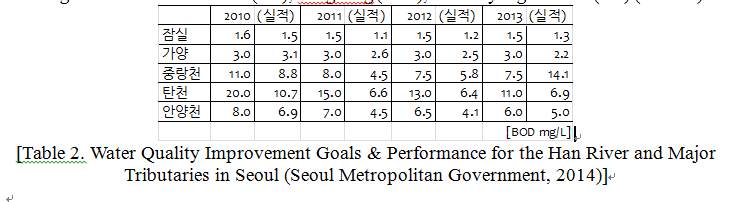
As for the tributaries, the BOD level depends on the quality of the upstream water. Those with higher levels were the Tan (6.9), Jungnang (14.1), and Anyang streams (5.0) (Table 2).
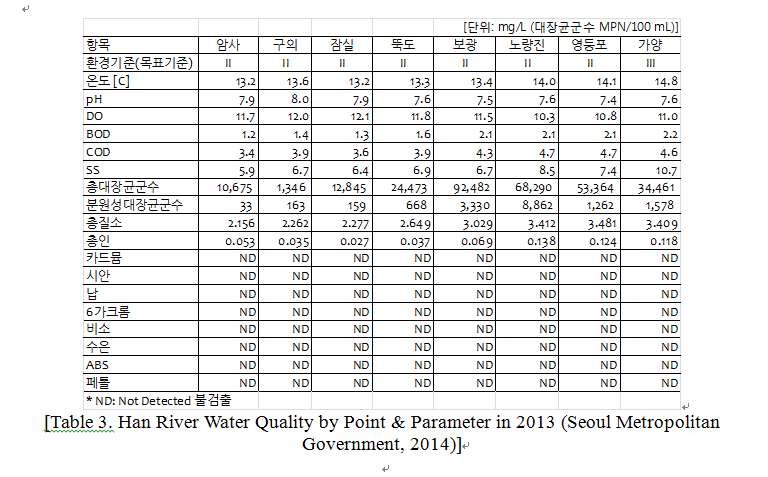
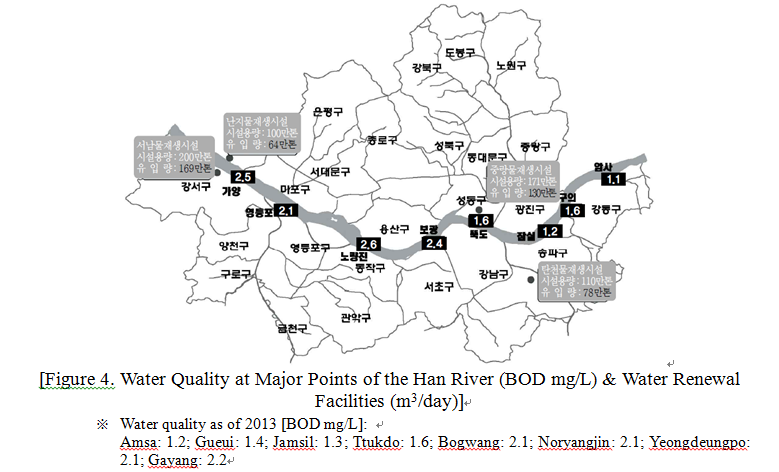
Stream water quality has been measured by the city and provincial institutes of public health & environment since 1974. The Ministry of Environment built an online national network in 1992 to collect the data on a regular basis. As of 2013, there were 443 points for water quality measurement on the Han River system. On the river segments in Seoul, there are 8 points on the main river and 19 points on the tributaries (Figure 4). A total of 36 parameters are measured at regular intervals (monthly, quarterly, or yearly) (Table 3).
Major Changes in Seoul’s Water Management Policies
Upstream Reservoir & Stream Management Policies
So far, the policies implemented to preserve the water quality of the Han River have focused on installation of sewage treatment facilities in urban areas and managing the sources of pollution. However, quality management of Han River water is only of limited scope without management of non-point source pollution in the city. Many development projects (industrial complexes, site development, farmland and forest management, roads, parking lots, etc.) have been pursued without much consideration for non-point source pollution. As pollution from such city sources continues to affect the Han, a new approach is imperative that takes non-point source pollution into account.
Foundation for Basic Environmental Protection Facilities
The 4 water treatment centers of Jungnang, Nanji, Tancheon, and Seonam processed a total 3.16 million m3/day as of the end of 2013, an amount which covers all wastewater produced in Seoul. Facilities capable of processing 1.75 million m3/day will be installed at the 4 centers to comply with stronger discharge water quality standards and the assigned total maximum daily load.
Stronger Management of Wastewater Discharge Facilities
Wastewater discharge facilities subject to guidance and inspections are provided with continued guidance and are inspected by the City of Seoul. They are encouraged to replace any deteriorating facilities and improve their abilities to prevent industrial wastewater from contaminating the water (Seoul Metropolitan Government, 2014).
Citizens Environment Watch
To monitor and stop pollution, a Citizens Environment Watch was organized in 2004. The group is a collaborative organization involving regulatory authorities, local residents, and private organizations, and is designed to jointly address pollution. It will lead to the establishment of a private-public environmental watch network which will enhance transparency and effectiveness in the guidance and inspection of pollutant discharging facilities while ensuring that the environmental watch and preservation activities are led by the private sector.
Water Pollution Alert
The Water Pollution Alert system was initiated in 1998 in response to the dead fish found in the Han River and its tributaries and has been in practice ever since to respond to other such incidents.
Automatic Monitoring System
A full-time monitoring system was introduced to prevent water pollution due to introduction of harmful chemicals to the streams, sewer pipes, and receiving waters at the water renewal facilities, while minimizing damage should pollution occur. The system is designed to monitor for and track unauthorized discharges.
The automatic system looks at 14 parameters, including cyanide, at 9 points on the main river (6 at the upstream reservoir and 3 at the streams themselves) and at 3 points along the tributaries. The water is monitored at 8 points for the presence of sixteen harmful chemicals, including the receiving water at the treatment center. Furthermore, oil fences and oil absorbents are available to handle oil spills, and emergency simulation training is held at the Han River every year.
| Category | Paldang Reservoir Protection Area | Special Paldang Reservoir Preservation Area | Nature Preservation Zone | Jamsil Reservoir Protection Area | Waterfront Area |
| Date Designated | July 9, 1975 | July 19, 1990 | December 31, 1982 | March 20, 1995 | September 30, 1999 |
| Legal Basis | Article 5, Water Supply & Waterworks Installation Act | Article 22, Framework Act on Environmental Policy | Article 6, Seoul Metropolitan Area Readjustment Planning Act | Article 5, Water Supply & Waterworks Installation Act | Article 4, Act on the Improvement of Water Quality & Support for Residents of the Riverhead of the Han River System |
| Area | 159 | 2,102 | 3,831 | 6.45 | 191.3 |
| Jurisdiction | 4 cities and gun counties in Gyeonggi Province | 61 eub/myeon districts in 7 cities and gun counties in Gyeonggi Province | 3 gun counties in 5 cities and gun counties in Gyeonggi Province | Upstream of Jamsil Reservoir, Gwangjin-gu, Songpa-gu, Gangdong-gu, and nearby riverside areas | 6 cities and gun counties in Gyeonggi Province, 2 cities in Gangwon Province, Chungju in North Chungcheong Province |
| Description | Restrictions on fishing, car washing, and other potentially polluting activities in the protected area | Special comprehensive plan for preservation of upstream reservoir (installation of basic environmental protection facilities, special pollution source management, change of intended use in certain districts | Restrictions on development of sites, industrial lots, and tourist attractions that increase the population | Restrictions on fishing, boating, car washing, and other potentially polluting activities in the protected area | Restrictions on installation of: facilities that generate general and livestock wastewater; accommodations; public bath facilities |
Total Maximum Daily Load
The water systems are divided into unit zones by total maximum daily load, with each of these zones assigned a water quality target and a total maximum allowed production of pollutants to maintain the target water quality. Existing regulations on concentrations were limited, considering the unique environmental characteristics and concentration of pollutant sources for each zone. This new system was introduced to adopt a more effective, scientific approach, assigning more responsibility to the involved parties.
The maximum load system was made mandatory for the Han River system, as for the Nakdong, Geum, Yeongsan, and Seomjin rivers, after revision of the Act on the Improvement of Water Quality & Support for Residents of the Riverhead of the Han River System on May 31, 2010. Accordingly, Seoul established its Framework Plan on Total Maximum Daily Load. An Action Plan on Total Maximum Daily Load was also established for unit zones where the target set by the Minister of Environment is exceeded. The system went into full effect in June 2013.
The Water Use Fee System
Water use fees are charged to areas downstream of the Han River system to finance the assistance that goes to residents and organizations living and operating in the upstream reservoir protected area and are under various restrictions due to measures to protect the water source. Installation and operation of basic environmental protection facilities and the purchase of land that may have a serious impact on the quality of the upstream water are also eligible for financial assistance from the water use fee system. This system was introduced to promote the prosperity of both the upstream and downstream regions of the Han. A certain amount is charged to final users who use water from the upstream source.
The collected fees are used in the following ways: the purchase of land in the water reservoir protection and waterfront area; resident assistance programs; as a proportion of local contributions for installation/operation of basic environmental protection facilities by local governments in the upstream reservoir area; operation of the Han River Watershed Management Committee; assistance for environmentally-friendly programs; and other programs launched as per the Presidential Decree towards improvement of the water quality of the upstream reservoir.
Changes in Waterworks Policies
Modern waterworks service began in Seoul when two Americans named Collbran and Bostwick obtained permission from the Korean Emperor Gojong to operate waterworks facilities and built a purification center in Ttukdo on September 1, 1908 to supply water. At the time, the production capacity was 12,500 m3/day, with water supplied to 125,000 people.
In 1946, 3 purification centers were built; in 1977, there were 5 purification centers . By 2004, some parts of the aging Gueui Purification Center and the purification centers in Noryangjin, Shinwol, Seonyu and Bogwang were closed. Today, there are 6 purification centers (Gwangam, Amsa, Gueui, Ttukdo, Yeongdeungpo, and Gangbuk) (Figure 5). As of the end of 2013, production capacity was 4.35 million m3/day , and the waterworks service rate is 100% (all citizens have access to the waterworks).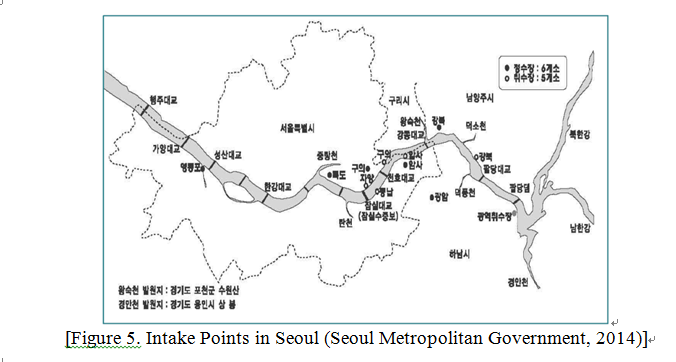
As stated above, in 1908 the purification capacity was 12,500 m3 of water per day, supplied to 125,000 people. As of the end of 2013, the capacity was 4.35 million m3/day, giving access to some 10.38 million people. The facility capacity grew 348 times and the number of people with access by 83 times.
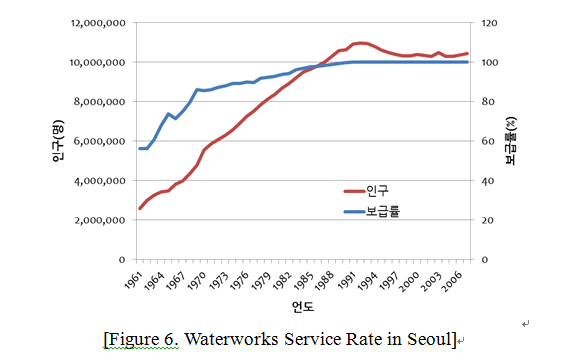
Until 1992, facility capacity was not sufficient for water demand, and there were difficulties with operation and supply. After 1998 however, the facilities reached sufficient capacity, ensuring a stable supply (Figure 6). In 2013, 11.6 billion m3 of tap water was used in Seoul, with the daily average being about 3.19 million m3.
Introduction of Advanced Purification Facilities
From the 1960s to the 1980s, the major focus of waterworks policy was on quantitative expansion, but from the 1990s, policies began targeting the assurance of water quality and stability of supply.
Into the 2000s, the city’s waterworks system improved in both quantitative and qualitative terms, and the policies focused on providing taste-free, safe tap water to residents.
Alongside these changes, there was a growing need for countermeasures to potential degradation of water quality at source and pollution due to climate change and urbanization. Accordingly, more advanced purification facilities were introduced. With the Ttukdo Arisu Purification Center as the last target in 2015, all purification centers will have installed these advanced purification systems . The currently installed system is primarily focused on controlling odor- and taste-generating particles from algae, but also seeks to respond to the potential for issues to be caused by new trace particles. When these new facilities are completed in 2015, the citizens of Seoul will have access to cleaner, safer tap water.
Flow Rate Improvement
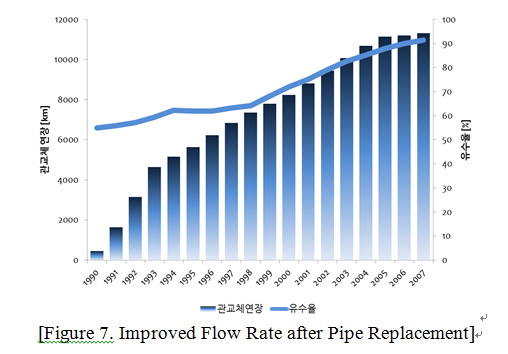
When the Office of Waterworks was launched in 1989, the flow rate in Seoul was 55.2%. By 2000, it had jumped to 72.0%, and to 95.1% in 2014, a level of success unprecedented in the world. Flow rate refers to the percentage of the amount collected in fees for the tap water produced and supplied by a purification center. For instance, the flow rate is 90% if 100 m3 of tap water is supplied to users and fees collected amount to the cost of producing 90 m3 of tap water. The higher the flow rate is, the lower the outside funding necessary for production and supply (e.g., raw water acquisition, purification chemicals, power, etc.), thereby improving the financial health of waterworks management. From 1989 to 2013, the flow rate improved by 39.2% (55.2% (1989) → 94.4% (2013)); in financial terms, this is equivalent to saving KRW 4.665 trillion (by unit price) since the launch of the Office of Waterworks.
Seoul has been able to improve the flow rate in several ways: continuing to repair old, leak-prone pipes; securing distribution stations; and switching to the run-of-river type to stabilize the water pressure and prevent related leaks. In addition, a flow monitoring system was adopted to monitor the flow and water pressure in real time. An effective leak detection method was employed as well. Seoul was divided into 2,037 small blocks and systematic leak detection carried out to quickly identify leaks and take appropriate action. Medium blocks (100 as of 2013) were also set up to analyze and manage the flow rate at the medium block level.
By 2017, Seoul aims to increase flow rate to 96.5% and will work to find the latest technologies that will improve and better manage the flow rate.
Distribution System Management
There were 13,721 km of distribution pipes installed in Seoul as of 2014. To improve the water quality and flow rate in the process of distribution, Seoul replaced deteriorating piping (13,192 km of the entire 13,728 km) from 1984 to 2013. By 2018, all deteriorating pipes will be replaced (Figure 7).
The distribution stations are capable of processing 2.42 million m3 of water, equal to about 13.9 hours of supply in case of an emergency. The capacity will be increased to 2.48 million m3 by 2030, about 15.0 hours’ worth. This will enable constant and direct supply that does not require water tanks at the customers’ end. The stability of water supply will be considerably enhanced, not to mention the water quality during the process of distribution.
Water Quality Management
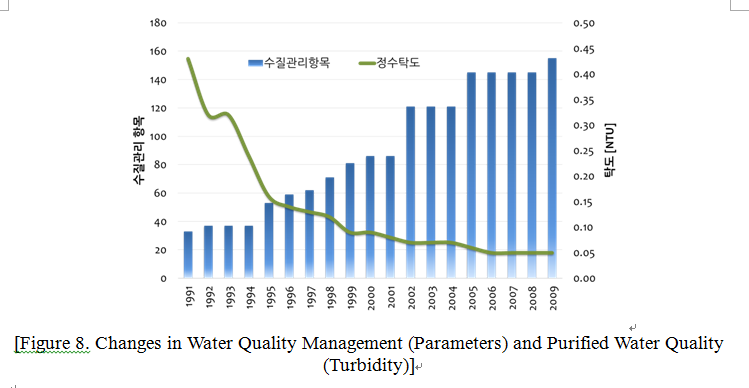
In 1990, South Korea had 28 water quality inspection parameters. The number of parameters went up gradually, and as of 2013, there were a total of 85 parameters – 59 statutory and 26 general monitoring parameters. As of 2012, Seoul conducted regular inspections according to 164 parameters (59 statutory and 105 parameters set by the city (including the parameters of the Ministry of Environment)) (Figure 8).
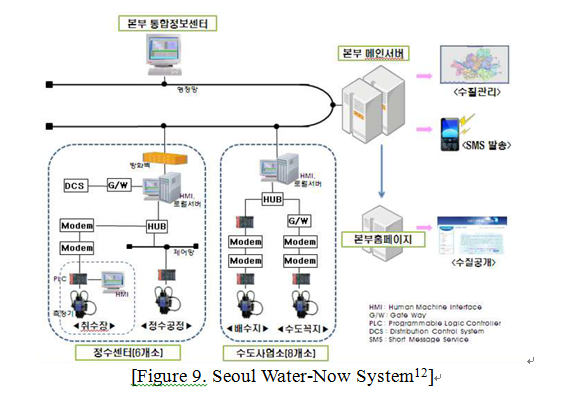
Seoul Water-Now System
The Seoul Water-Now System monitors water quality in real time 24 hours a day, from source to faucet. It is installed at 200 locations: intake points, purification centers, distribution stations, pumping station, parks, and faucets (during the supply process) (Figure 9). The quality of the water thus monitored is disclosed to the public in real time to enhance transparency and reliability of the waterworks administration. The Seoul Water-Now System has been recognized by the international community for its excellence in providing administrative services to satisfy residents’ right to know and protect their health. Along with Arisu Quality Certification, it won the grand prize at the UN Public Service Awards (UNPSA) on June 23, 2009.
Changes in Sewer-Related Policies
During the Joseon Dynasty, sewage flowed on street surfaces or in low-lying areas, passing through low ditches and flowing into the streams or underground. There were virtually no facilities or efforts at management. However, Cheonggye Stream, one of Seoul’s major streams, had undergone dredging and other related works. In the 12th year of King Taejong (1412), full construction works were carried out at Cheonggye Stream and other streams so as to prevent them from flooding.
During the years of the Korean Empire (1897-1910), a 6,832 m long culvert built as part of the city sewer project was the first modern sewer pipe. Since then however, there is no record of maintenance or management.
The modern concept of a sewer system was applied when the 225 km long main and branch sewer lines were installed over 4 occasions, from 1921 to 1945, after Korea was forcibly annexed by Japan. This system was constructed to prevent pollution from urban flooding and wastewater and to process fecal material that was being discharged without control.
Until the 1960s, the main purpose of the sewers was to expel stormwater from the city, and lines were built in efforts to improve the street environment. After that decade, South Korea began experiencing dramatic economic growth accompanied by rapid industrialization and urbanization, improved quality of life, and change of method in treatment of fecal material , amplifying the pollution load from wastewater. Accordingly, people began to take interest in the construction of sewage treatment facilities and a separate sewer system.
The sewer system as we know it began, thanks to international aid South Korea received after 1954 for post-war restoration.
In 1959, the first construction to cover Cheonggye Stream began. In 1966, the Sewerage Act was passed, and the Cheonggye Stream Wastewater Treatment Center (150,000 m3/day) began construction with a USAID loan and completed in 1976. The early 1960s were politically challenging for South Korea, but this did not stop the government from pursuing the sewage system project. Consequently, the pre-1961 sewer pipe network more than doubled in length from 631 km to 1,462 km (Figure 10).
The 1970s was a decade of sewer expansion ; the existing sewer system was actively repaired while new facilities were built and renovated with fervor.
After 1987, the number of wastewater treatment facilities jumped, mainly to prepare for the Olympics in 1988. Between 1986 and 1999, sewerage capacity grew 39 times, from 150,000 m3/day to 5.81 million m3/day.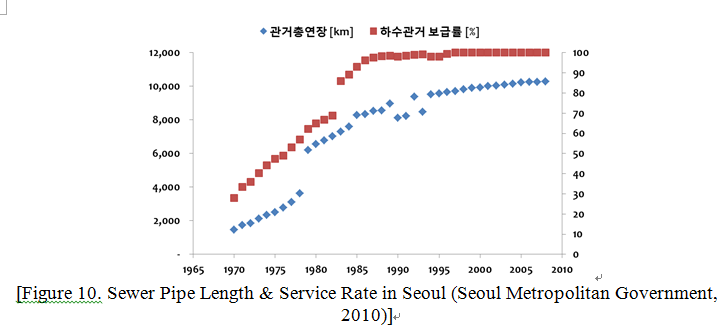
In 2005, the purpose and concept of wastewater treatment were clearly defined. To ensure that the system is sustainable and ready for future climate changes, the facilities, usually referred to as wastewater treatment facilities, were called water treatment centers.
In line with the strengthened standards on water discharged from water treatment centers, an advanced treatment system was introduced. In 2007, the new system, which had a capacity of 460,000 m3/day was applied to Jungnang Water Treatment Center; by 2012, the system was also installed at 4 other water treatment centers, representing a total capacity of 3.91 million m3/day. At Jungnang and Seonam Water Treatment Centers, the system was installed while some of their facilities were incorporated into the underground system while the aboveground space was modernized and transformed into a park for local residents (Table 5).
| Category | Total | Jungnang | Nanji | Tancheon | Seonam | |
| Capacity | Advanced Treatment | 391 | 88 | 86 | 90 | 127 |
| Facility Modernization | 61 | 25 | - | - | 36 | |
| Cost | 774,717 | 327,220 | 48,120 | 93,377 | 206,000 | |
| Construction Period | 2009/1 – 2018/12 | 2009/2 – 2016/12 | 2009/7 – 2013/4 | 2009/1 – 2013/5 | 2009/11 – 2018/12 | |
As mentioned earlier, focus was placed on quantitative expansion of sewerage capacity in the late 1980s. Sewer pipes were added and improved as well. The total length of the sewer network, which was 6,559 km in 1980, increased 1.4 times to 9,122 km by 1990. In each year since, 200 km of piping has been improved.
In the 1990s, projects were implemented to restore the functions of sewer pipes as they are fundamental urban facilities that protect the environment. From 1992 to 2001, the network was examined by zone to replace deteriorating and damaged pipes in a systematic manner (Table 5).
By 2007, all citizens had access to the sewer system. From then on, Seoul placed more focus on quality management of the system, user satisfaction, and policy tasks designed to ensure safety (Figure 11).
Such change and policy direction for the future are well represented in the 2020 Seoul Sewerage Vision. The policy directions as seen in the Vision are as follows:
- Enhanced capabilities to prevent potential disasters caused by climate change;
- Efficient and systematic repair and maintenance of deteriorating pipe;
- Improved living environment and service to the public;
- More realistic water billing to secure sufficient financing;
- Advanced sewage treatment and modernization;
- People-friendly water treatment centers;
- Energy saving at water treatment centers;
- Operational efficiency at water treatment centers;
- Launch of renewable energy programs.
Restoration of the Environment & Ecosystem
Restoration of the environment and ecosystem, one of Seoul’s water management policies, and policy indicators and objectives are well described in the Seoul Water Quality and Ecosystem Preservation Plan 2014 - 2018 (Seoul Metropolitan Government, 2014). The vision of this plan is to create a “City with a Healthy Water Environment for Peaceful Cohabitation of People and Nature” so as to restore the balance of the city’s aquatic ecosystem. The Plan includes 5 strategies and 12 programs
Other than steps to preserve water quality and the ecosystem, the Plan also includes action and strategies that encompass the entirety of the sustainable water reclamation system.
This is significant in that it changes the policy paradigm from water quality management to preservation and maintenance of a healthy aquatic ecosystem through various means, such as restoring stream and river ecosystems to their natural, healthy state, and conducting assessments and inspections of these ecosystems (Table 6).
| Area | 2012 Water Quality | 2018 Target Water Quality | ||||
| BOD | COD | T-P | BOD | COD | T-P | |
| Jungnang Stream Area (Downstream) | 5.8 (Slightly Poor) |
12.3 (Very Poor) |
1.267 (Very Poor) |
5.0 (Fair) |
8.6 (Slightly Poor) |
0.649 (Very Poor) |
| Tan Stream Area (Downstream) | 6.4 (Slightly Poor) |
9.6 (Poor) |
0.598 (Very Poor) |
5.0 (Fair) |
7.0 (Fair) |
0.200 (Fair) |
| Anyang Stream Area (Downstream) | 4.1 (Fair) |
8.4 (Slightly Poor) |
0.211 (Slightly Poor) |
4.0 (Fair) |
7.0 (Fair) |
0.159 (Fair) |
| Hongje Stream Area (Hongje Stream) | 3.0 (Slightly Good) |
5.1 (Fair) |
0.080 (Slightly Good) |
3.0 (Slightly Good) |
4.8 (Slightly Good) |
0.070 (Slightly Good) |
| Han River (Haengju Bridge Point) | 4.1 (Fair) |
6.8 (Fair) |
0.290 (Slightly Poor) |
3.8 (Fair) |
5.0 (Slightly Good) |
0.141 (Fair) |
Staying Safe from Flood Risk
In the past decade, Seoul’s annual average rainfall was 1,550 mm, 70% or more of which comes in the torrential rains occurring during the summer months (June – August). The city suffered major damage in 1987, 1990, 1998, 2001, 2010, and 2011. Every decade or so, Seoul sees 2 or 3 major floods. Most of the damage was to buildings and facilities, crippling urban functions (blocking traffic, causing blackouts, suspending communications etc.) (Figure 13).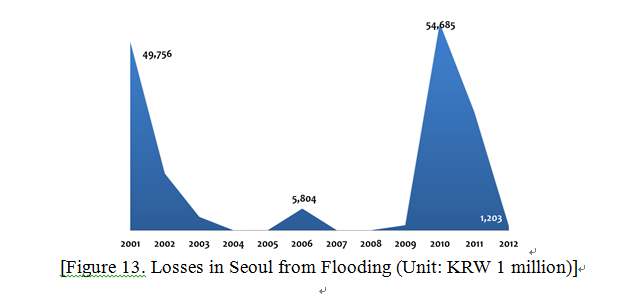
For the past 30 years (1971 – 2001), rainfall has steadily increased from 1,344 mm to 1,550 mm. Analysis of the relationship between rainfall (hourly maximum and daily maximum) and financial damage in the years when flood damage was serious (1987, 1990, 1998, 2001, 2010, and 2011) shows no clear tendency but the greater the volume or intensity of rainfall, the greater the property damage. The extent of flood damage was determined largely by the climate, particularly in the amount of rain.
Flood damage occurs usually in flat, low-lying areas with poor drainage, especially to semi-underground housing, underground spaces (underground arcade, etc.), and roads. In some parts of the city however, the nature of the flood damage is rather complex, a combination of both inland and river (e.g., overflows) floods caused by heavy rain and the antecedent conditions of precipitation.
Seoul has for some time worked on improving its stream systems, sewer systems, inland flood control facilities, and other facilities designed to prevent water-related disasters (sewer pipes, rainwater pumping stations, reservoirs, etc.). These facilities are at a relatively advanced level, and yet storm and flood damage have not abated, owing to global climate change and the effects of urban development. The Basic Sewage Improvement Plan of 2009 planned to respond to climate change and heavy rainfall by reinforcing the recurrence interval standards for sewer pipes from 5 years (main) and 10 years (branch) to 10 years and 30 years respectively. From the 9,380 km long sewage line, 476 km (5.1%) have interruptions in their flow due to old designs. Considering the reinforced recurrence interval in the future (30 years for the main, 10 years for the branches), 618 km (6.6%) are estimated to be inadequate. Flood-prone zones should therefore be selected for repair and maintenance of any inadequate or deteriorating pipes on a continual basis, while upgrading the capacity of some of the rainwater pumping stations that have reached their limit in order to better prevent inland floods.
While the urbanization of Seoul has helped expand built-up areas, it has also increased the impervious surface area. This reality gives rise to urban flooding, urban heat islands, and other forms of natural disasters, undermining healthy water reclamation and destroying the habitat of many lives. According to urban ecosystem research done in 2010, 47.6% of Seoul’s surface area was impervious (Figure 14).
Green belts and open spaces with an impervious surface rate of less than 10% accounted for 43.6%; areas with an impervious surface rate of 90% or more accounted for 37.2%; areas with an impervious surface rate of between 70% and 89% were 11.1%. Since the 2000s, the most noticeable change in the impervious surface rate was a reduction of the areas with a 90% or higher or 10% or lower rate and an increase in the areas that were in the 30% – 90% range. While reduction of the areas with an impervious surface rate of 90% or more is desirable, the change in the impervious rate is rather extreme across the city. Reduction of the areas with an impervious surface rate of 90% or more seems to have been caused by redevelopment and improvement that aimed to secure sufficient green space for a more natural ecosystem. However, areas in the 70% – 90% range have increased due to the development of roads and commercial and business districts, hindering overall improvement. It is therefore necessary to devise a way to reduce the impervious surface rate in development projects undertaken.
Safety management to prevent urban disasters can be divided into 4 strategies: 1) reinforcing preventive action; 2) enhancing disaster response; 3) developing a complete restoration system; and 4) making improvements through participation and communication.
Among these, the tasks designed to prevent water-related disasters are as follows:
- Make improvements in 29 flood-prone zones
- Prevent the loss of human life in the river systems
- Reinforce management of basement housing units in flood-prone areas
- Integrate management of disaster prevention facilities by basin
- Improve street level drains
- Encourage residents in vulnerable areas to buy insurance
- Increase rainwater management capacity 8-fold by 2020 (from 5.6 mm to 46.5 mm)
Seoul’s Water Management Policy: Challenges
Seoul’s water management policies achieved remarkable development in a relatively short period of time. The spectrum of the city’s technical and policy experience and performance is broad. However, policy challenges include finding new resolutions so as to create a more pleasant and safer city for the residents.
Of primary importance is that any policy approach should be based on the understanding that raw water and water sources must be managed more stringently to ensure the Han River system is clean and safe. While such efforts are already in place and have had some success, more emphasis is needed that management at the source must be as strict as during the supply and treatment process. We do not have to refer to US or European cases to understand the necessity. Management at the source is indeed one of the most crucial elements of integrated water management policies (WHO).
Another challenge is to be prepared for new trace particles. PPCPs and CEC’s (Contaminants of Emerging Concern) are detected now at low concentrations but must nevertheless be monitored and managed because they affect health and the aquatic ecosystem (EPA, 2011). Most such substances are not yet regulated but are on the increase every year, both in amount and type. It is especially important that the relevant departments work together closely to address the matter.
The Han River is the only source of water for Seoul. Climate change and urbanization have increased the possibility of water pollution, and it is critical to find other sources for the sake of economics and safety. Development of sources outside of surface water would include passive methods (groundwater and rainwater) as well as more proactive means (reuse of wastewater).
Rainwater in particular can be utilized through rainwater management facilities, as they will help water to circulate in and out of dry seasons. Policies can also consider reducing base flow by pumping in water to maintain the streams.
Effective management of rainwater and groundwater is increasingly important, not just from the perspective of water resources management, but also with an eye on prevention of disasters (e.g., road collapses, floods) and safety. Policies should pay attention to increasing surface permeability in the city to increase groundwater levels, and to developing artificial groundwater replenishment technology.
Due to climate change and urbanization, Seoul sees more torrential rain flooding, landslides, and other storm and undesirable water-related events, as well as an increase in their severity. Structural measures – improvements to disaster prevention facilities – as well as an integrated approach to built-up areas are necessary. Urban planning and management of construction is also crucial. Other necessary measures include: a warning system and provision of relevant information for prevention; upgrades to the emergency response system to minimize damage and loss of life; and consideration of regional characteristics to refine response and approach.
Countermeasures against flooding should consider direct impact on buildings and other structures but should also take on a more dimensional approach toward urban planning, housing, improvement of the residential environment, and green parks. It should also be noted that urban planning and the residential environment should include flood-related safety measures.
For the future, a more integrated water management system should be included in Seoul’s water management policies. This integrated system would involve integrated management of all water resources including rainwater and groundwater, as well as technical and policies regarding the waterworks and sewer system. This system should address the technical and policy challenges in a way that assures the sustainable use of water and other energy resources related to the use and reuse of water.
As we have examined the changes in Seoul’s water management policies, especially as related to waterworks and sewers, the city, with a system built in the midst of rapid urbanization and quantitative growth, will now need to focus on stability and quality so as to develop an integrated system that will provide the foundation for sustainable water management in the future.
References
- Joongang Daily, 2001, Managing & Taking Advantage of Water, http://article.joins.com/news/article/article.asp?total_id=4083435&ctg=10
- Seoul Development Institute, 2011, Urbanization & Water Reclamation (presentation for the 2011 Water Reclamation Symposium).
- The Office of Waterworks, 2015, 2014 Major Programs Status (internal data).
- Kim Yeong-ran, 2012, The Effect of Urbanization on Water Reclamation & Status in Seoul (presentation for the 2012 Water Reclamation City Forum).
- Seoul Metropolitan Government, 2009, Seoul Comprehensive Plan for the Water Environment.
- Seoul Development Institute, 2011, Urbanization & Water Reclamation (presentation for the 2011 Water Reclamation Symposium).
- Seoul Metropolitan Government, 2013 The City of Seoul Environment White Paper: the Environment of Seoul, 2014.
- Seoul Metropolitan Government, 2009 Guide to the Sewage System in Seoul, 2010.
- Ministry of Environment, 2015, Environment Statistics, http://stat.me.go.kr/nesis/mesp2/webStatistics/stat_main.jsp?tblID=DT_106N_ZZZ_001217&inq_gubun=1#
- WHO, Protecting drinking-water sources through regulation, http://www.who.int/water_sanitation_health/dwq/sheet4.pdf
- EPA, 2011, Treating Contaminants of Emerging Concern, US EPA Office of Water, EPA-820-R-10-002.
- Seoul Metropolitan Government, 2014, Seoul Water Quality & Ecosystem Preservation Plan 2014 – 2018, Water Management Policy, Seoul Metropolitan Government.